Cambodian vs Iraqi Median Male Earnings
COMPARE
Cambodian
Iraqi
Median Male Earnings
Median Male Earnings Comparison
Cambodians
Iraqis
$62,516
MEDIAN MALE EARNINGS
100.0/ 100
METRIC RATING
44th/ 347
METRIC RANK
$54,182
MEDIAN MALE EARNINGS
42.5/ 100
METRIC RATING
180th/ 347
METRIC RANK
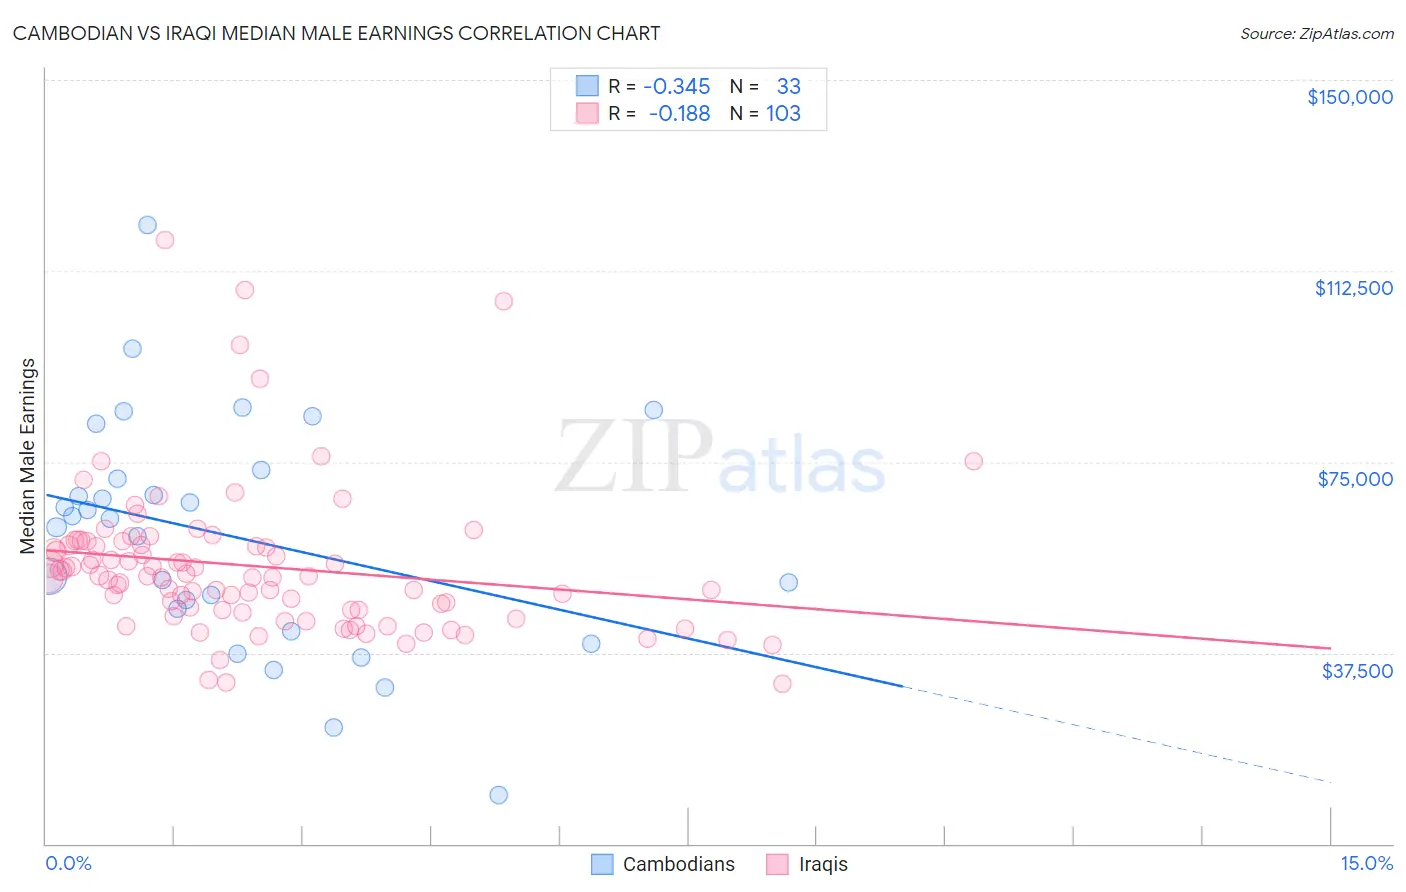
Cambodian vs Iraqi Median Male Earnings Correlation Chart
The statistical analysis conducted on geographies consisting of 102,506,129 people shows a mild negative correlation between the proportion of Cambodians and median male earnings in the United States with a correlation coefficient (R) of -0.345 and weighted average of $62,516. Similarly, the statistical analysis conducted on geographies consisting of 170,629,617 people shows a poor negative correlation between the proportion of Iraqis and median male earnings in the United States with a correlation coefficient (R) of -0.188 and weighted average of $54,182, a difference of 15.4%.
Median Male Earnings Correlation Summary
| Measurement | Cambodian | Iraqi |
| Minimum | $9,467 | $31,325 |
| Maximum | $121,577 | $118,495 |
| Range | $112,110 | $87,170 |
| Mean | $60,326 | $54,518 |
| Median | $63,742 | $52,559 |
| Interquartile 25% (IQ1) | $43,962 | $45,816 |
| Interquartile 75% (IQ3) | $72,546 | $58,664 |
| Interquartile Range (IQR) | $28,584 | $12,848 |
| Standard Deviation (Sample) | $22,914 | $14,678 |
| Standard Deviation (Population) | $22,564 | $14,607 |
Similar Demographics by Median Male Earnings
Demographics Similar to Cambodians by Median Male Earnings
In terms of median male earnings, the demographic groups most similar to Cambodians are Bulgarian ($62,378, a difference of 0.22%), Immigrants from Belarus ($62,658, a difference of 0.23%), Immigrants from Greece ($62,689, a difference of 0.28%), Immigrants from Turkey ($62,728, a difference of 0.34%), and Immigrants from Czechoslovakia ($62,217, a difference of 0.48%).
| Demographics | Rating | Rank | Median Male Earnings |
| Immigrants | Sri Lanka | 100.0 /100 | #37 | Exceptional $63,099 |
| Maltese | 100.0 /100 | #38 | Exceptional $62,953 |
| Immigrants | South Africa | 100.0 /100 | #39 | Exceptional $62,899 |
| Australians | 100.0 /100 | #40 | Exceptional $62,857 |
| Immigrants | Turkey | 100.0 /100 | #41 | Exceptional $62,728 |
| Immigrants | Greece | 100.0 /100 | #42 | Exceptional $62,689 |
| Immigrants | Belarus | 100.0 /100 | #43 | Exceptional $62,658 |
| Cambodians | 100.0 /100 | #44 | Exceptional $62,516 |
| Bulgarians | 100.0 /100 | #45 | Exceptional $62,378 |
| Immigrants | Czechoslovakia | 99.9 /100 | #46 | Exceptional $62,217 |
| Immigrants | Austria | 99.9 /100 | #47 | Exceptional $62,164 |
| Immigrants | Malaysia | 99.9 /100 | #48 | Exceptional $62,121 |
| Immigrants | Europe | 99.9 /100 | #49 | Exceptional $62,057 |
| Bhutanese | 99.9 /100 | #50 | Exceptional $61,759 |
| Estonians | 99.9 /100 | #51 | Exceptional $61,710 |
Demographics Similar to Iraqis by Median Male Earnings
In terms of median male earnings, the demographic groups most similar to Iraqis are Immigrants ($54,168, a difference of 0.030%), Celtic ($54,242, a difference of 0.11%), Costa Rican ($54,279, a difference of 0.18%), Sierra Leonean ($54,279, a difference of 0.18%), and Spaniard ($54,401, a difference of 0.40%).
| Demographics | Rating | Rank | Median Male Earnings |
| South American Indians | 50.4 /100 | #173 | Average $54,508 |
| South Americans | 50.0 /100 | #174 | Average $54,492 |
| Dutch | 48.0 /100 | #175 | Average $54,410 |
| Spaniards | 47.8 /100 | #176 | Average $54,401 |
| Costa Ricans | 44.8 /100 | #177 | Average $54,279 |
| Sierra Leoneans | 44.8 /100 | #178 | Average $54,279 |
| Celtics | 43.9 /100 | #179 | Average $54,242 |
| Iraqis | 42.5 /100 | #180 | Average $54,182 |
| Immigrants | Immigrants | 42.1 /100 | #181 | Average $54,168 |
| Yugoslavians | 37.4 /100 | #182 | Fair $53,967 |
| Immigrants | South America | 37.3 /100 | #183 | Fair $53,962 |
| Whites/Caucasians | 36.5 /100 | #184 | Fair $53,925 |
| Immigrants | Sierra Leone | 36.0 /100 | #185 | Fair $53,905 |
| Colombians | 34.4 /100 | #186 | Fair $53,832 |
| Immigrants | Eritrea | 31.8 /100 | #187 | Fair $53,715 |