Lebanese vs Iraqi Householder Income Under 25 years
COMPARE
Lebanese
Iraqi
Householder Income Under 25 years
Householder Income Under 25 years Comparison
Lebanese
Iraqis
$50,355
HOUSEHOLDER INCOME UNDER 25 YEARS
1.1/ 100
METRIC RATING
257th/ 347
METRIC RANK
$50,802
HOUSEHOLDER INCOME UNDER 25 YEARS
3.2/ 100
METRIC RATING
238th/ 347
METRIC RANK
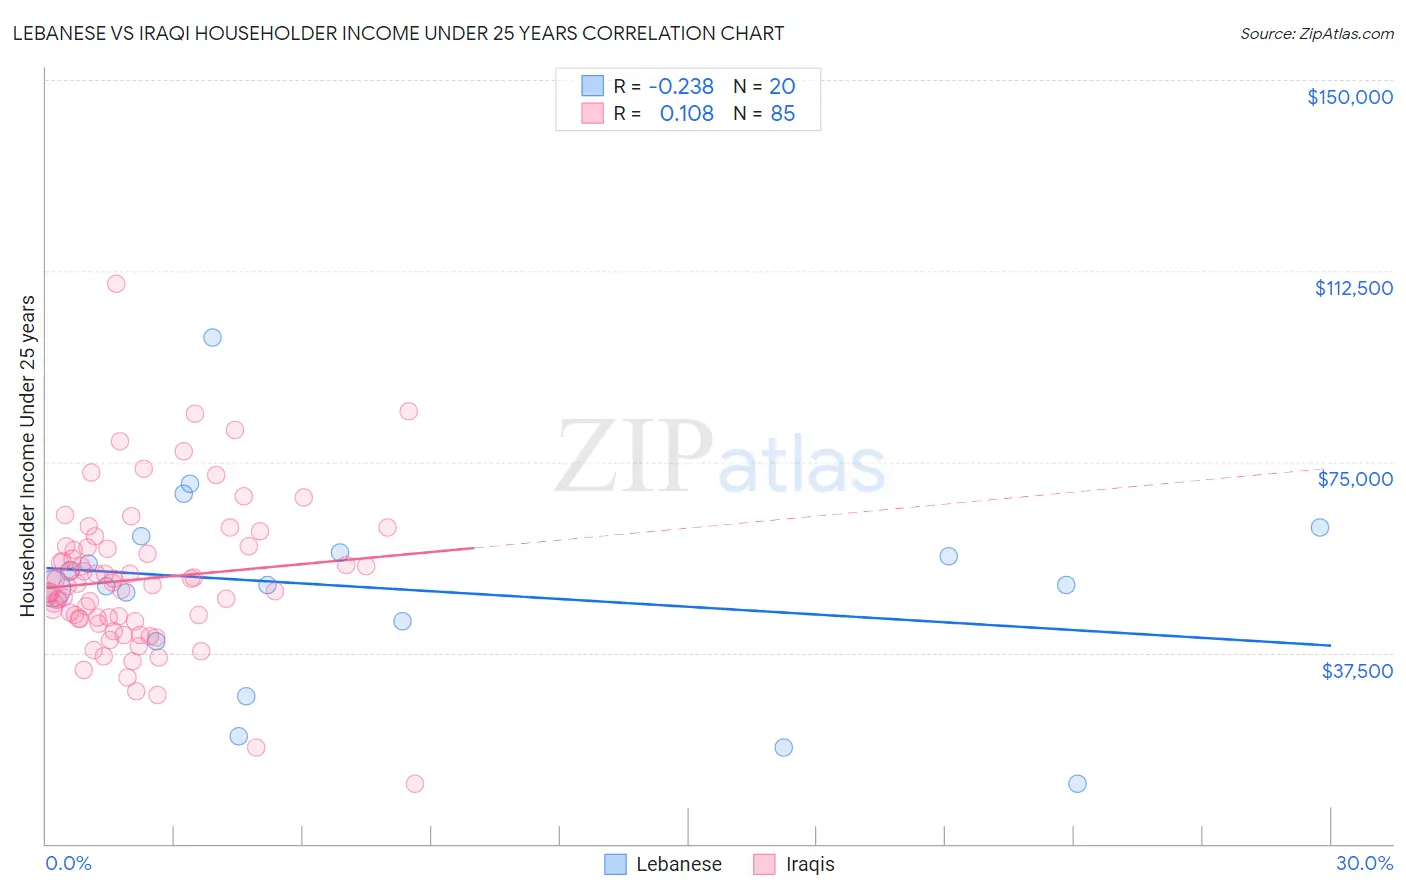
Lebanese vs Iraqi Householder Income Under 25 years Correlation Chart
The statistical analysis conducted on geographies consisting of 337,299,986 people shows a weak negative correlation between the proportion of Lebanese and household income with householder under the age of 25 in the United States with a correlation coefficient (R) of -0.238 and weighted average of $50,355. Similarly, the statistical analysis conducted on geographies consisting of 156,411,431 people shows a poor positive correlation between the proportion of Iraqis and household income with householder under the age of 25 in the United States with a correlation coefficient (R) of 0.108 and weighted average of $50,802, a difference of 0.89%.
Householder Income Under 25 years Correlation Summary
| Measurement | Lebanese | Iraqi |
| Minimum | $11,835 | $11,835 |
| Maximum | $99,421 | $109,885 |
| Range | $87,586 | $98,050 |
| Mean | $49,958 | $51,943 |
| Median | $50,777 | $50,714 |
| Interquartile 25% (IQ1) | $41,651 | $44,189 |
| Interquartile 75% (IQ3) | $58,726 | $58,150 |
| Interquartile Range (IQR) | $17,075 | $13,961 |
| Standard Deviation (Sample) | $19,834 | $14,592 |
| Standard Deviation (Population) | $19,332 | $14,506 |
Demographics Similar to Lebanese and Iraqis by Householder Income Under 25 years
In terms of householder income under 25 years, the demographic groups most similar to Lebanese are Aleut ($50,377, a difference of 0.040%), Immigrants from Cuba ($50,374, a difference of 0.040%), Luxembourger ($50,379, a difference of 0.050%), Immigrants from Haiti ($50,398, a difference of 0.090%), and Immigrants from Mexico ($50,422, a difference of 0.13%). Similarly, the demographic groups most similar to Iraqis are German ($50,804, a difference of 0.0%), Immigrants from Caribbean ($50,757, a difference of 0.090%), Immigrants from Lebanon ($50,729, a difference of 0.14%), Immigrants from Micronesia ($50,691, a difference of 0.22%), and Cuban ($50,655, a difference of 0.29%).
| Demographics | Rating | Rank | Householder Income Under 25 years |
| Germans | 3.3 /100 | #237 | Tragic $50,804 |
| Iraqis | 3.2 /100 | #238 | Tragic $50,802 |
| Immigrants | Caribbean | 2.9 /100 | #239 | Tragic $50,757 |
| Immigrants | Lebanon | 2.7 /100 | #240 | Tragic $50,729 |
| Immigrants | Micronesia | 2.5 /100 | #241 | Tragic $50,691 |
| Cubans | 2.3 /100 | #242 | Tragic $50,655 |
| Immigrants | Thailand | 2.2 /100 | #243 | Tragic $50,645 |
| Marshallese | 2.1 /100 | #244 | Tragic $50,627 |
| Immigrants | Africa | 2.0 /100 | #245 | Tragic $50,609 |
| Welsh | 2.0 /100 | #246 | Tragic $50,597 |
| Immigrants | Bosnia and Herzegovina | 1.8 /100 | #247 | Tragic $50,565 |
| Slavs | 1.8 /100 | #248 | Tragic $50,563 |
| Scottish | 1.8 /100 | #249 | Tragic $50,554 |
| Immigrants | Cabo Verde | 1.7 /100 | #250 | Tragic $50,520 |
| Celtics | 1.4 /100 | #251 | Tragic $50,447 |
| Immigrants | Mexico | 1.3 /100 | #252 | Tragic $50,422 |
| Immigrants | Haiti | 1.2 /100 | #253 | Tragic $50,398 |
| Luxembourgers | 1.2 /100 | #254 | Tragic $50,379 |
| Aleuts | 1.2 /100 | #255 | Tragic $50,377 |
| Immigrants | Cuba | 1.2 /100 | #256 | Tragic $50,374 |
| Lebanese | 1.1 /100 | #257 | Tragic $50,355 |