Lebanese vs Iraqi Average Family Size
COMPARE
Lebanese
Iraqi
Average Family Size
Average Family Size Comparison
Lebanese
Iraqis
3.19
AVERAGE FAMILY SIZE
9.1/ 100
METRIC RATING
220th/ 347
METRIC RANK
3.24
AVERAGE FAMILY SIZE
64.3/ 100
METRIC RATING
158th/ 347
METRIC RANK
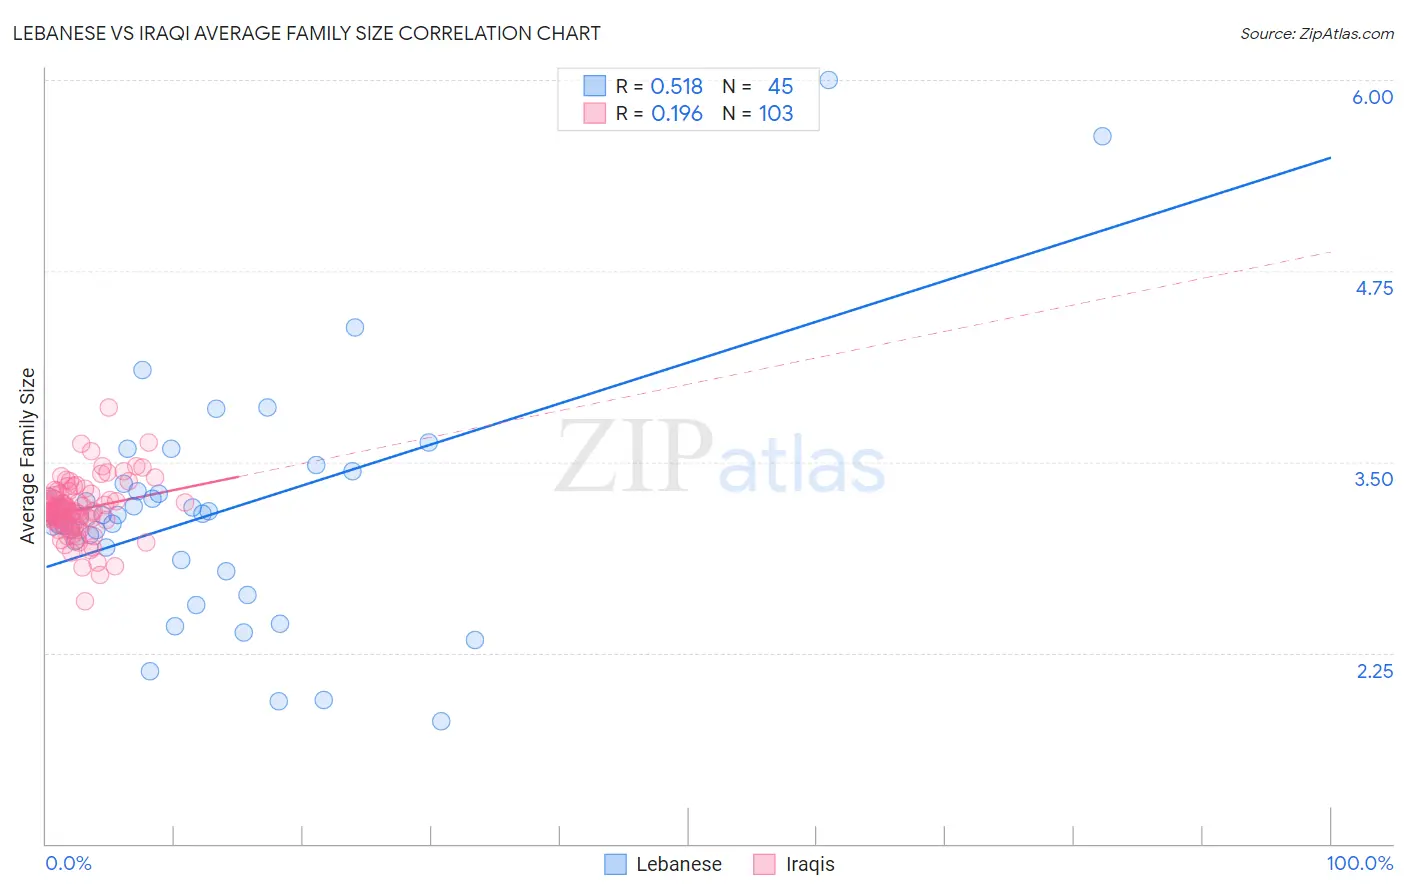
Lebanese vs Iraqi Average Family Size Correlation Chart
The statistical analysis conducted on geographies consisting of 401,332,213 people shows a substantial positive correlation between the proportion of Lebanese and average family size in the United States with a correlation coefficient (R) of 0.518 and weighted average of 3.19. Similarly, the statistical analysis conducted on geographies consisting of 170,567,061 people shows a poor positive correlation between the proportion of Iraqis and average family size in the United States with a correlation coefficient (R) of 0.196 and weighted average of 3.24, a difference of 1.3%.
Average Family Size Correlation Summary
| Measurement | Lebanese | Iraqi |
| Minimum | 1.80 | 2.59 |
| Maximum | 6.00 | 3.86 |
| Range | 4.20 | 1.27 |
| Mean | 3.18 | 3.19 |
| Median | 3.15 | 3.18 |
| Interquartile 25% (IQ1) | 2.82 | 3.10 |
| Interquartile 75% (IQ3) | 3.40 | 3.26 |
| Interquartile Range (IQR) | 0.58 | 0.16 |
| Standard Deviation (Sample) | 0.79 | 0.18 |
| Standard Deviation (Population) | 0.78 | 0.18 |
Similar Demographics by Average Family Size
Demographics Similar to Lebanese by Average Family Size
In terms of average family size, the demographic groups most similar to Lebanese are Pennsylvania German (3.19, a difference of 0.010%), French American Indian (3.20, a difference of 0.040%), Immigrants from Somalia (3.20, a difference of 0.060%), Delaware (3.20, a difference of 0.10%), and Bermudan (3.20, a difference of 0.10%).
| Demographics | Rating | Rank | Average Family Size |
| Mongolians | 11.5 /100 | #213 | Poor 3.20 |
| Somalis | 11.2 /100 | #214 | Poor 3.20 |
| Delaware | 11.1 /100 | #215 | Poor 3.20 |
| Bermudans | 11.0 /100 | #216 | Poor 3.20 |
| Immigrants | Somalia | 10.3 /100 | #217 | Poor 3.20 |
| French American Indians | 9.8 /100 | #218 | Tragic 3.20 |
| Pennsylvania Germans | 9.3 /100 | #219 | Tragic 3.19 |
| Lebanese | 9.1 /100 | #220 | Tragic 3.19 |
| Immigrants | Ukraine | 7.2 /100 | #221 | Tragic 3.19 |
| Immigrants | Kuwait | 7.2 /100 | #222 | Tragic 3.19 |
| Immigrants | Zimbabwe | 7.1 /100 | #223 | Tragic 3.19 |
| Syrians | 6.5 /100 | #224 | Tragic 3.19 |
| Cree | 6.2 /100 | #225 | Tragic 3.19 |
| Chickasaw | 6.0 /100 | #226 | Tragic 3.19 |
| Portuguese | 6.0 /100 | #227 | Tragic 3.19 |
Demographics Similar to Iraqis by Average Family Size
In terms of average family size, the demographic groups most similar to Iraqis are Ethiopian (3.24, a difference of 0.010%), Immigrants from Iraq (3.24, a difference of 0.010%), Immigrants from Chile (3.24, a difference of 0.020%), Immigrants from Uzbekistan (3.24, a difference of 0.050%), and Seminole (3.24, a difference of 0.080%).
| Demographics | Rating | Rank | Average Family Size |
| Jordanians | 73.5 /100 | #151 | Good 3.24 |
| Spanish Americans | 72.5 /100 | #152 | Good 3.24 |
| Immigrants | Eritrea | 71.4 /100 | #153 | Good 3.24 |
| Immigrants | Egypt | 70.0 /100 | #154 | Good 3.24 |
| Seminole | 68.2 /100 | #155 | Good 3.24 |
| Immigrants | Taiwan | 68.1 /100 | #156 | Good 3.24 |
| Immigrants | Uzbekistan | 67.0 /100 | #157 | Good 3.24 |
| Iraqis | 64.3 /100 | #158 | Good 3.24 |
| Ethiopians | 63.9 /100 | #159 | Good 3.24 |
| Immigrants | Iraq | 63.7 /100 | #160 | Good 3.24 |
| Immigrants | Chile | 63.2 /100 | #161 | Good 3.24 |
| Immigrants | Uganda | 60.1 /100 | #162 | Good 3.23 |
| Uruguayans | 58.8 /100 | #163 | Average 3.23 |
| Egyptians | 58.6 /100 | #164 | Average 3.23 |
| Ugandans | 58.4 /100 | #165 | Average 3.23 |