Lebanese vs Iraqi Per Capita Income
COMPARE
Lebanese
Iraqi
Per Capita Income
Per Capita Income Comparison
Lebanese
Iraqis
$45,840
PER CAPITA INCOME
92.0/ 100
METRIC RATING
123rd/ 347
METRIC RANK
$42,760
PER CAPITA INCOME
26.7/ 100
METRIC RATING
192nd/ 347
METRIC RANK
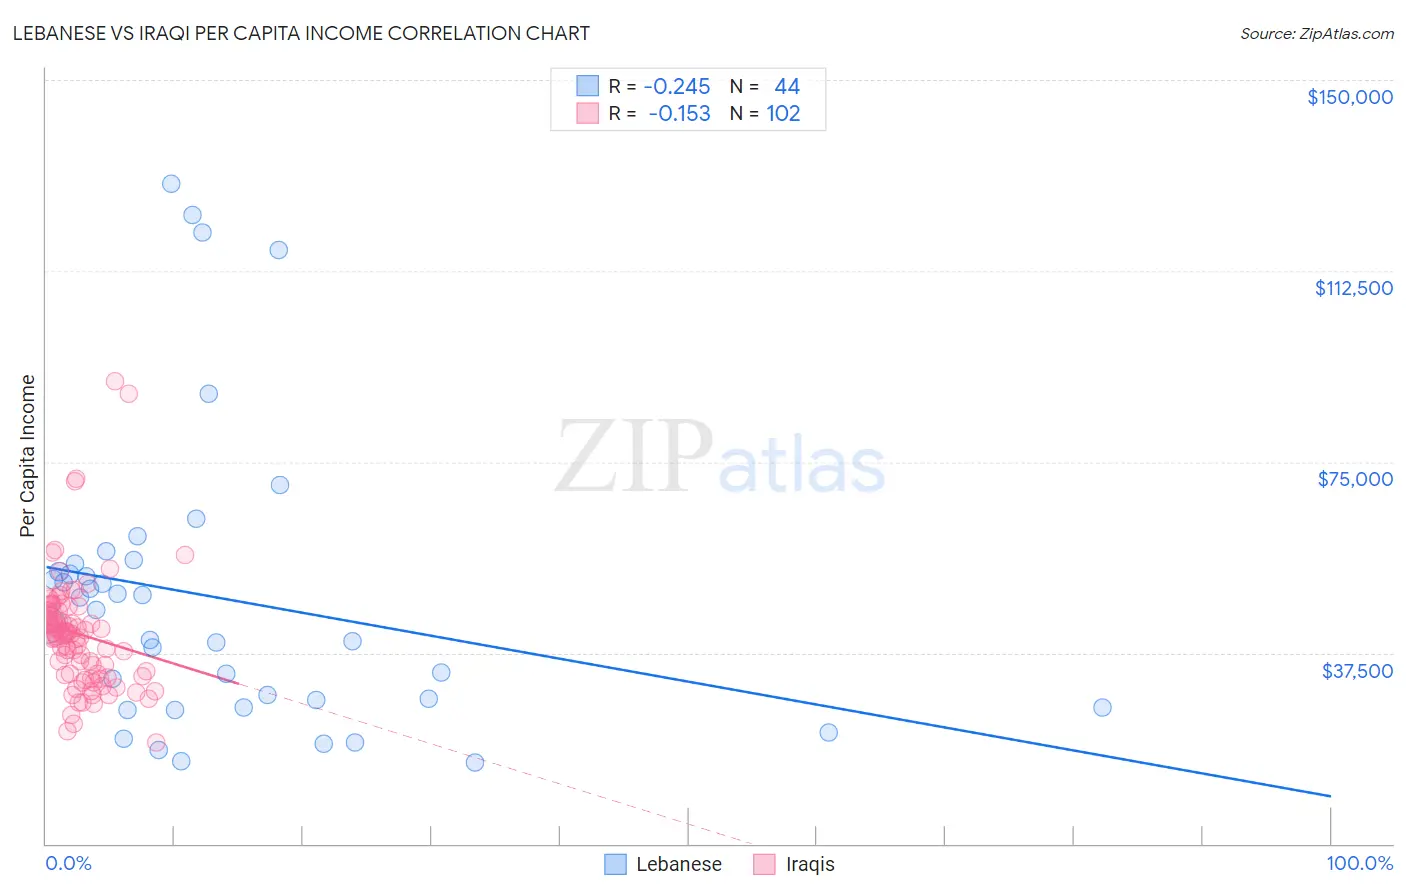
Lebanese vs Iraqi Per Capita Income Correlation Chart
The statistical analysis conducted on geographies consisting of 401,645,404 people shows a weak negative correlation between the proportion of Lebanese and per capita income in the United States with a correlation coefficient (R) of -0.245 and weighted average of $45,840. Similarly, the statistical analysis conducted on geographies consisting of 170,626,957 people shows a poor negative correlation between the proportion of Iraqis and per capita income in the United States with a correlation coefficient (R) of -0.153 and weighted average of $42,760, a difference of 7.2%.
Per Capita Income Correlation Summary
| Measurement | Lebanese | Iraqi |
| Minimum | $15,839 | $19,973 |
| Maximum | $129,581 | $90,903 |
| Range | $113,742 | $70,930 |
| Mean | $48,201 | $41,246 |
| Median | $44,395 | $41,205 |
| Interquartile 25% (IQ1) | $27,415 | $33,285 |
| Interquartile 75% (IQ3) | $54,286 | $45,684 |
| Interquartile Range (IQR) | $26,871 | $12,399 |
| Standard Deviation (Sample) | $28,531 | $11,272 |
| Standard Deviation (Population) | $28,205 | $11,217 |
Similar Demographics by Per Capita Income
Demographics Similar to Lebanese by Per Capita Income
In terms of per capita income, the demographic groups most similar to Lebanese are European ($45,836, a difference of 0.010%), Moroccan ($45,854, a difference of 0.030%), Canadian ($45,858, a difference of 0.040%), Zimbabwean ($45,804, a difference of 0.080%), and Palestinian ($45,790, a difference of 0.11%).
| Demographics | Rating | Rank | Per Capita Income |
| Poles | 94.1 /100 | #116 | Exceptional $46,123 |
| Chinese | 93.9 /100 | #117 | Exceptional $46,098 |
| Immigrants | Saudi Arabia | 93.3 /100 | #118 | Exceptional $46,008 |
| Immigrants | Poland | 93.1 /100 | #119 | Exceptional $45,979 |
| Immigrants | Ethiopia | 92.7 /100 | #120 | Exceptional $45,923 |
| Canadians | 92.2 /100 | #121 | Exceptional $45,858 |
| Moroccans | 92.1 /100 | #122 | Exceptional $45,854 |
| Lebanese | 92.0 /100 | #123 | Exceptional $45,840 |
| Europeans | 92.0 /100 | #124 | Exceptional $45,836 |
| Zimbabweans | 91.7 /100 | #125 | Exceptional $45,804 |
| Palestinians | 91.6 /100 | #126 | Exceptional $45,790 |
| Immigrants | Germany | 91.3 /100 | #127 | Exceptional $45,751 |
| Swedes | 91.3 /100 | #128 | Exceptional $45,750 |
| Luxembourgers | 90.4 /100 | #129 | Exceptional $45,663 |
| Arabs | 90.4 /100 | #130 | Exceptional $45,662 |
Demographics Similar to Iraqis by Per Capita Income
In terms of per capita income, the demographic groups most similar to Iraqis are Immigrants from Sierra Leone ($42,752, a difference of 0.020%), Yugoslavian ($42,792, a difference of 0.070%), Kenyan ($42,808, a difference of 0.11%), Immigrants from Fiji ($42,694, a difference of 0.16%), and Immigrants from Kenya ($42,661, a difference of 0.23%).
| Demographics | Rating | Rank | Per Capita Income |
| Immigrants | Immigrants | 32.5 /100 | #185 | Fair $43,010 |
| French Canadians | 32.3 /100 | #186 | Fair $43,003 |
| Immigrants | Colombia | 31.5 /100 | #187 | Fair $42,971 |
| Immigrants | Africa | 31.0 /100 | #188 | Fair $42,950 |
| Bermudans | 30.1 /100 | #189 | Fair $42,911 |
| Kenyans | 27.7 /100 | #190 | Fair $42,808 |
| Yugoslavians | 27.4 /100 | #191 | Fair $42,792 |
| Iraqis | 26.7 /100 | #192 | Fair $42,760 |
| Immigrants | Sierra Leone | 26.5 /100 | #193 | Fair $42,752 |
| Immigrants | Fiji | 25.2 /100 | #194 | Fair $42,694 |
| Immigrants | Kenya | 24.5 /100 | #195 | Fair $42,661 |
| Dutch | 23.4 /100 | #196 | Fair $42,605 |
| Scotch-Irish | 22.6 /100 | #197 | Fair $42,563 |
| Immigrants | Portugal | 19.7 /100 | #198 | Poor $42,412 |
| Barbadians | 19.6 /100 | #199 | Poor $42,406 |