Iranian vs Immigrants from Lithuania Wage/Income Gap
COMPARE
Iranian
Immigrants from Lithuania
Wage/Income Gap
Wage/Income Gap Comparison
Iranians
Immigrants from Lithuania
29.7%
WAGE/INCOME GAP
0.0/ 100
METRIC RATING
339th/ 347
METRIC RANK
28.6%
WAGE/INCOME GAP
0.1/ 100
METRIC RATING
311th/ 347
METRIC RANK
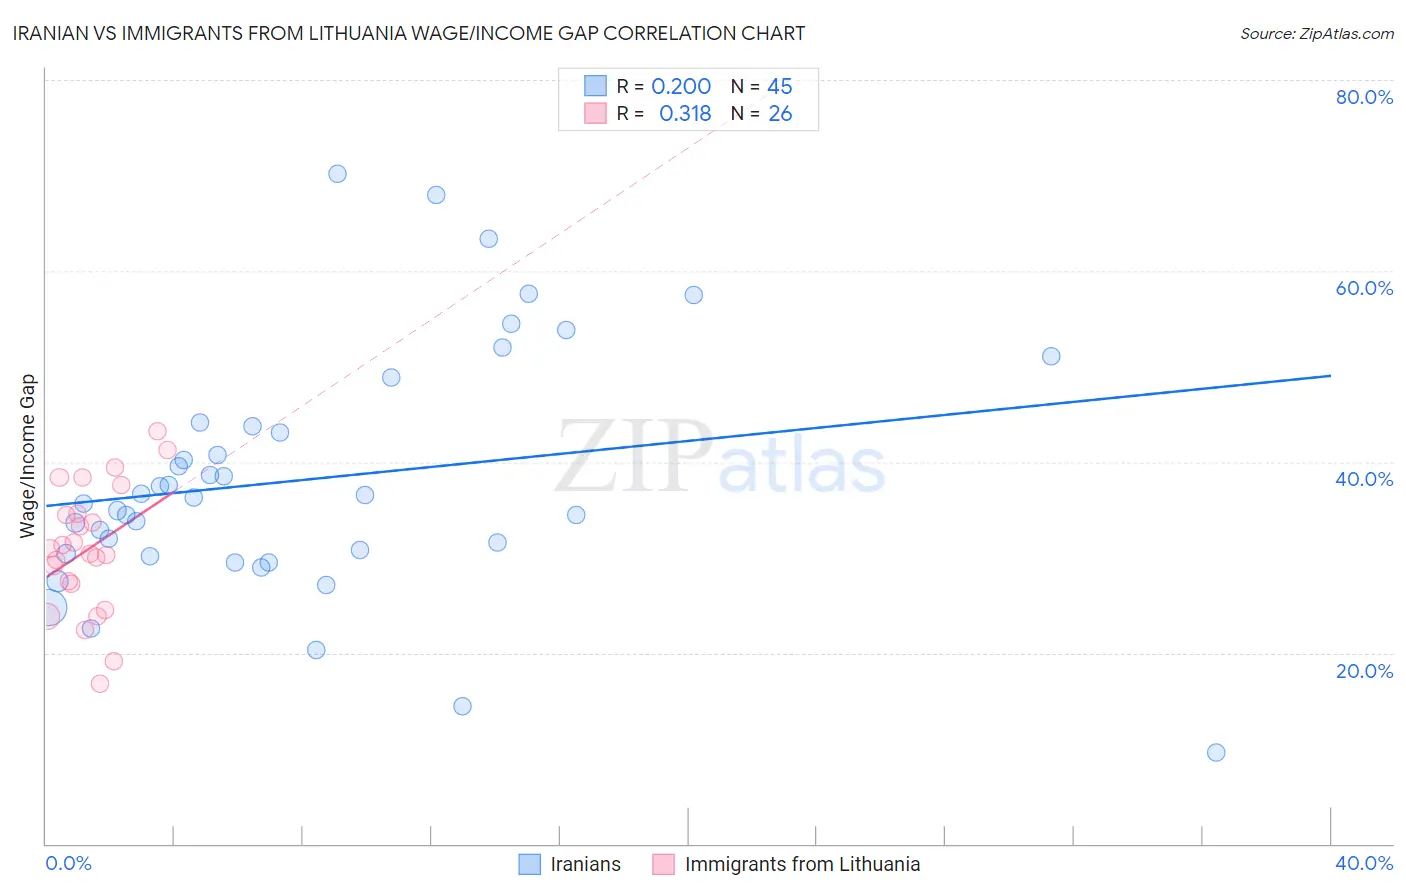
Iranian vs Immigrants from Lithuania Wage/Income Gap Correlation Chart
The statistical analysis conducted on geographies consisting of 316,773,224 people shows a weak positive correlation between the proportion of Iranians and wage/income gap percentage in the United States with a correlation coefficient (R) of 0.200 and weighted average of 29.7%. Similarly, the statistical analysis conducted on geographies consisting of 117,698,624 people shows a mild positive correlation between the proportion of Immigrants from Lithuania and wage/income gap percentage in the United States with a correlation coefficient (R) of 0.318 and weighted average of 28.6%, a difference of 3.9%.
Wage/Income Gap Correlation Summary
| Measurement | Iranian | Immigrants from Lithuania |
| Minimum | 9.6% | 16.8% |
| Maximum | 70.1% | 43.2% |
| Range | 60.5% | 26.5% |
| Mean | 38.2% | 30.9% |
| Median | 36.2% | 30.7% |
| Interquartile 25% (IQ1) | 30.2% | 27.3% |
| Interquartile 75% (IQ3) | 44.0% | 34.5% |
| Interquartile Range (IQR) | 13.8% | 7.3% |
| Standard Deviation (Sample) | 12.9% | 6.7% |
| Standard Deviation (Population) | 12.8% | 6.5% |
Similar Demographics by Wage/Income Gap
Demographics Similar to Iranians by Wage/Income Gap
In terms of wage/income gap, the demographic groups most similar to Iranians are Filipino (29.7%, a difference of 0.060%), Dutch (29.6%, a difference of 0.28%), Swiss (30.0%, a difference of 0.83%), English (29.5%, a difference of 0.86%), and Immigrants from Taiwan (29.5%, a difference of 0.87%).
| Demographics | Rating | Rank | Wage/Income Gap |
| Immigrants | South Central Asia | 0.0 /100 | #332 | Tragic 29.3% |
| Europeans | 0.0 /100 | #333 | Tragic 29.4% |
| Swedes | 0.0 /100 | #334 | Tragic 29.4% |
| Immigrants | Taiwan | 0.0 /100 | #335 | Tragic 29.5% |
| English | 0.0 /100 | #336 | Tragic 29.5% |
| Dutch | 0.0 /100 | #337 | Tragic 29.6% |
| Filipinos | 0.0 /100 | #338 | Tragic 29.7% |
| Iranians | 0.0 /100 | #339 | Tragic 29.7% |
| Swiss | 0.0 /100 | #340 | Tragic 30.0% |
| Thais | 0.0 /100 | #341 | Tragic 30.5% |
| Pennsylvania Germans | 0.0 /100 | #342 | Tragic 30.7% |
| Danes | 0.0 /100 | #343 | Tragic 31.0% |
| Assyrians/Chaldeans/Syriacs | 0.0 /100 | #344 | Tragic 31.0% |
| Immigrants | India | 0.0 /100 | #345 | Tragic 31.5% |
| Cajuns | 0.0 /100 | #346 | Tragic 33.9% |
Demographics Similar to Immigrants from Lithuania by Wage/Income Gap
In terms of wage/income gap, the demographic groups most similar to Immigrants from Lithuania are Finnish (28.6%, a difference of 0.070%), Eastern European (28.6%, a difference of 0.13%), Macedonian (28.6%, a difference of 0.16%), Polish (28.5%, a difference of 0.25%), and French (28.7%, a difference of 0.26%).
| Demographics | Rating | Rank | Wage/Income Gap |
| Immigrants | Netherlands | 0.2 /100 | #304 | Tragic 28.5% |
| Immigrants | South Africa | 0.1 /100 | #305 | Tragic 28.5% |
| Whites/Caucasians | 0.1 /100 | #306 | Tragic 28.5% |
| Immigrants | Denmark | 0.1 /100 | #307 | Tragic 28.5% |
| Poles | 0.1 /100 | #308 | Tragic 28.5% |
| Macedonians | 0.1 /100 | #309 | Tragic 28.6% |
| Finns | 0.1 /100 | #310 | Tragic 28.6% |
| Immigrants | Lithuania | 0.1 /100 | #311 | Tragic 28.6% |
| Eastern Europeans | 0.1 /100 | #312 | Tragic 28.6% |
| French | 0.1 /100 | #313 | Tragic 28.7% |
| Immigrants | Scotland | 0.1 /100 | #314 | Tragic 28.7% |
| Maltese | 0.1 /100 | #315 | Tragic 28.7% |
| Lithuanians | 0.1 /100 | #316 | Tragic 28.7% |
| Belgians | 0.1 /100 | #317 | Tragic 28.8% |
| Basques | 0.1 /100 | #318 | Tragic 28.8% |