Iranian vs Bermudan Median Earnings
COMPARE
Iranian
Bermudan
Median Earnings
Median Earnings Comparison
Iranians
Bermudans
$58,474
MEDIAN EARNINGS
100.0/ 100
METRIC RATING
7th/ 347
METRIC RANK
$45,593
MEDIAN EARNINGS
23.5/ 100
METRIC RATING
212th/ 347
METRIC RANK
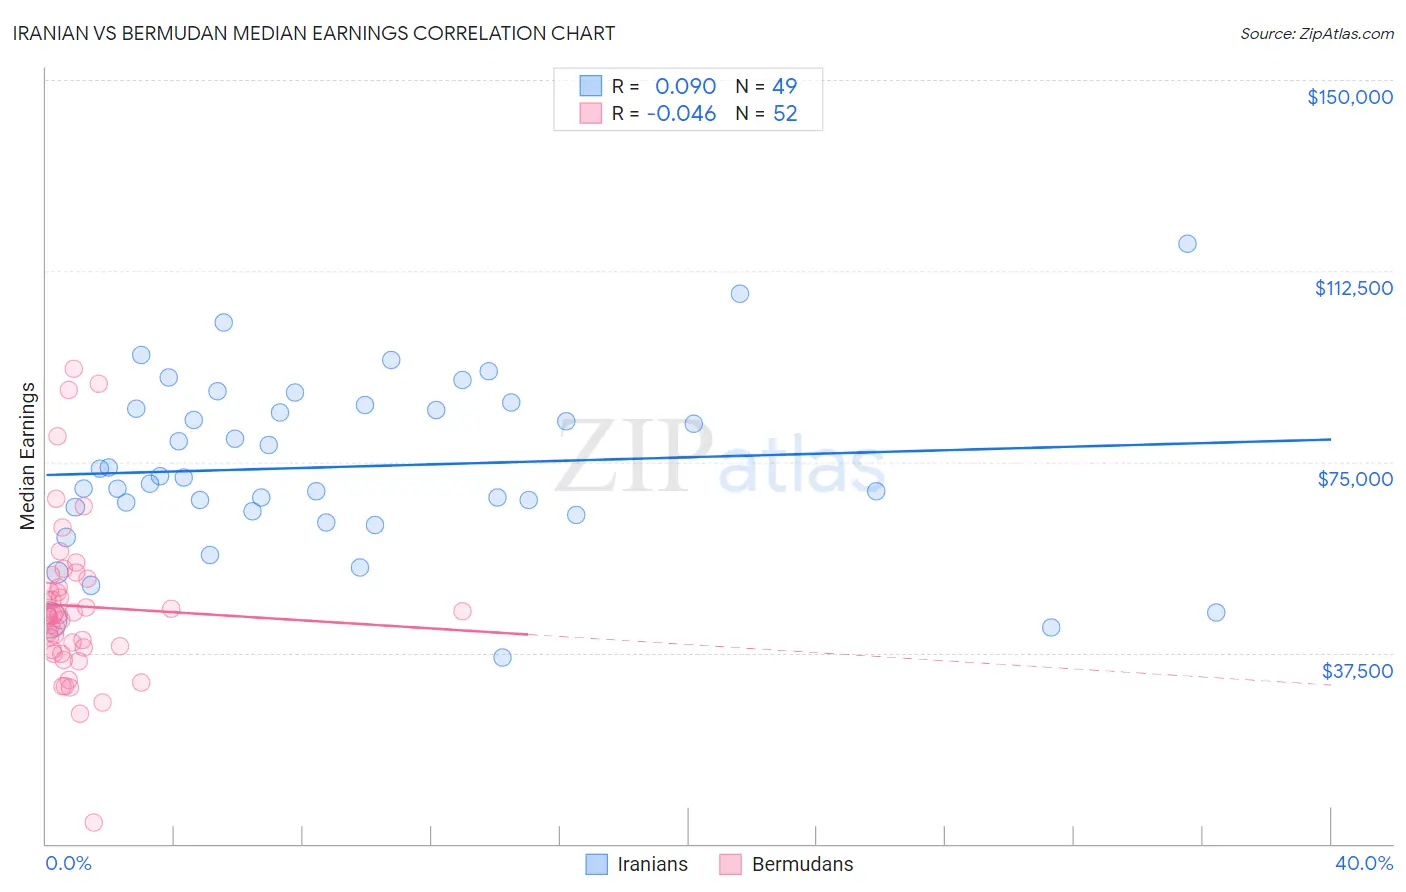
Iranian vs Bermudan Median Earnings Correlation Chart
The statistical analysis conducted on geographies consisting of 316,848,979 people shows a slight positive correlation between the proportion of Iranians and median earnings in the United States with a correlation coefficient (R) of 0.090 and weighted average of $58,474. Similarly, the statistical analysis conducted on geographies consisting of 55,730,379 people shows no correlation between the proportion of Bermudans and median earnings in the United States with a correlation coefficient (R) of -0.046 and weighted average of $45,593, a difference of 28.2%.
Median Earnings Correlation Summary
| Measurement | Iranian | Bermudan |
| Minimum | $36,458 | $4,250 |
| Maximum | $117,883 | $93,350 |
| Range | $81,425 | $89,100 |
| Mean | $74,068 | $46,670 |
| Median | $72,050 | $44,943 |
| Interquartile 25% (IQ1) | $64,975 | $38,258 |
| Interquartile 75% (IQ3) | $85,806 | $51,130 |
| Interquartile Range (IQR) | $20,831 | $12,872 |
| Standard Deviation (Sample) | $17,049 | $16,028 |
| Standard Deviation (Population) | $16,874 | $15,873 |
Similar Demographics by Median Earnings
Demographics Similar to Iranians by Median Earnings
In terms of median earnings, the demographic groups most similar to Iranians are Immigrants from Singapore ($59,038, a difference of 0.97%), Thai ($59,237, a difference of 1.3%), Immigrants from Iran ($57,612, a difference of 1.5%), Okinawan ($57,550, a difference of 1.6%), and Immigrants from Hong Kong ($59,433, a difference of 1.6%).
| Demographics | Rating | Rank | Median Earnings |
| Filipinos | 100.0 /100 | #1 | Exceptional $61,197 |
| Immigrants | Taiwan | 100.0 /100 | #2 | Exceptional $61,151 |
| Immigrants | India | 100.0 /100 | #3 | Exceptional $60,648 |
| Immigrants | Hong Kong | 100.0 /100 | #4 | Exceptional $59,433 |
| Thais | 100.0 /100 | #5 | Exceptional $59,237 |
| Immigrants | Singapore | 100.0 /100 | #6 | Exceptional $59,038 |
| Iranians | 100.0 /100 | #7 | Exceptional $58,474 |
| Immigrants | Iran | 100.0 /100 | #8 | Exceptional $57,612 |
| Okinawans | 100.0 /100 | #9 | Exceptional $57,550 |
| Immigrants | South Central Asia | 100.0 /100 | #10 | Exceptional $57,114 |
| Immigrants | Israel | 100.0 /100 | #11 | Exceptional $57,034 |
| Immigrants | Ireland | 100.0 /100 | #12 | Exceptional $56,854 |
| Immigrants | China | 100.0 /100 | #13 | Exceptional $56,638 |
| Immigrants | Australia | 100.0 /100 | #14 | Exceptional $56,305 |
| Indians (Asian) | 100.0 /100 | #15 | Exceptional $56,253 |
Demographics Similar to Bermudans by Median Earnings
In terms of median earnings, the demographic groups most similar to Bermudans are Panamanian ($45,593, a difference of 0.0%), Immigrants from Bosnia and Herzegovina ($45,600, a difference of 0.010%), Immigrants from Thailand ($45,598, a difference of 0.010%), Immigrants from Grenada ($45,596, a difference of 0.010%), and Immigrants from Senegal ($45,611, a difference of 0.040%).
| Demographics | Rating | Rank | Median Earnings |
| Tongans | 25.4 /100 | #205 | Fair $45,665 |
| Immigrants | Ghana | 24.8 /100 | #206 | Fair $45,641 |
| Immigrants | Senegal | 24.0 /100 | #207 | Fair $45,611 |
| Immigrants | Bosnia and Herzegovina | 23.7 /100 | #208 | Fair $45,600 |
| Immigrants | Thailand | 23.7 /100 | #209 | Fair $45,598 |
| Immigrants | Grenada | 23.6 /100 | #210 | Fair $45,596 |
| Panamanians | 23.5 /100 | #211 | Fair $45,593 |
| Bermudans | 23.5 /100 | #212 | Fair $45,593 |
| Immigrants | Colombia | 22.4 /100 | #213 | Fair $45,550 |
| Nigerians | 22.0 /100 | #214 | Fair $45,532 |
| Immigrants | Bangladesh | 22.0 /100 | #215 | Fair $45,532 |
| Guyanese | 20.6 /100 | #216 | Fair $45,470 |
| Tlingit-Haida | 20.5 /100 | #217 | Fair $45,468 |
| Spanish | 19.7 /100 | #218 | Poor $45,432 |
| Dutch | 18.4 /100 | #219 | Poor $45,370 |