Venezuelan vs Pennsylvania German Wage/Income Gap
COMPARE
Venezuelan
Pennsylvania German
Wage/Income Gap
Wage/Income Gap Comparison
Venezuelans
Pennsylvania Germans
26.3%
WAGE/INCOME GAP
21.5/ 100
METRIC RATING
198th/ 347
METRIC RANK
30.7%
WAGE/INCOME GAP
0.0/ 100
METRIC RATING
342nd/ 347
METRIC RANK
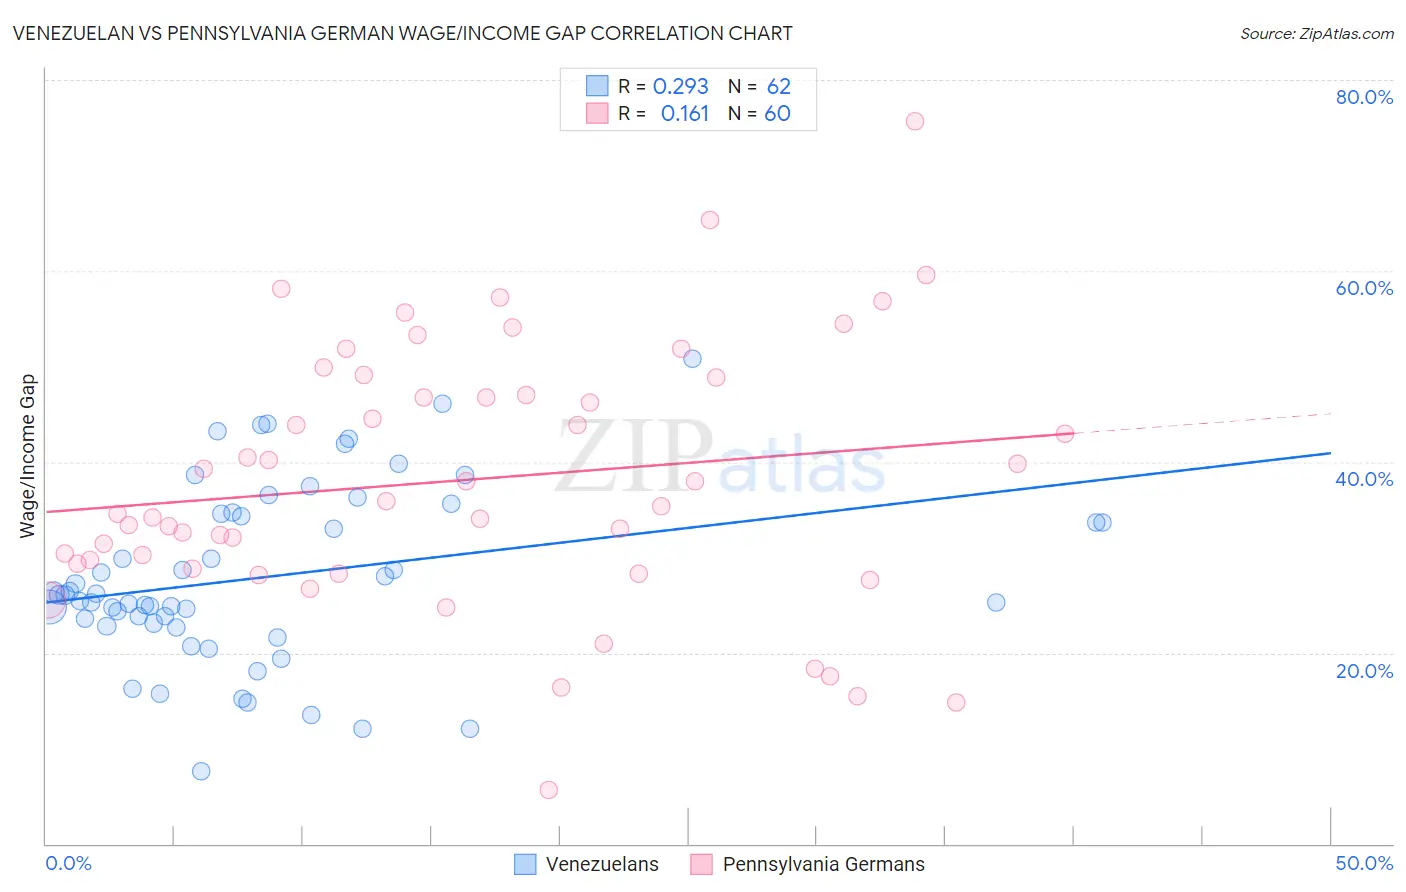
Venezuelan vs Pennsylvania German Wage/Income Gap Correlation Chart
The statistical analysis conducted on geographies consisting of 306,223,372 people shows a weak positive correlation between the proportion of Venezuelans and wage/income gap percentage in the United States with a correlation coefficient (R) of 0.293 and weighted average of 26.3%. Similarly, the statistical analysis conducted on geographies consisting of 233,865,703 people shows a poor positive correlation between the proportion of Pennsylvania Germans and wage/income gap percentage in the United States with a correlation coefficient (R) of 0.161 and weighted average of 30.7%, a difference of 16.7%.
Wage/Income Gap Correlation Summary
| Measurement | Venezuelan | Pennsylvania German |
| Minimum | 7.6% | 5.6% |
| Maximum | 50.8% | 75.6% |
| Range | 43.2% | 70.1% |
| Mean | 27.9% | 38.1% |
| Median | 26.1% | 35.6% |
| Interquartile 25% (IQ1) | 23.1% | 29.1% |
| Interquartile 75% (IQ3) | 34.6% | 48.0% |
| Interquartile Range (IQR) | 11.4% | 18.9% |
| Standard Deviation (Sample) | 9.2% | 13.8% |
| Standard Deviation (Population) | 9.2% | 13.6% |
Similar Demographics by Wage/Income Gap
Demographics Similar to Venezuelans by Wage/Income Gap
In terms of wage/income gap, the demographic groups most similar to Venezuelans are Zimbabwean (26.3%, a difference of 0.010%), Immigrants from Western Asia (26.3%, a difference of 0.020%), Dutch West Indian (26.3%, a difference of 0.050%), Delaware (26.3%, a difference of 0.050%), and Immigrants from Malaysia (26.3%, a difference of 0.070%).
| Demographics | Rating | Rank | Wage/Income Gap |
| Immigrants | Venezuela | 24.7 /100 | #191 | Fair 26.2% |
| Immigrants | Bulgaria | 22.5 /100 | #192 | Fair 26.3% |
| Immigrants | Jordan | 22.4 /100 | #193 | Fair 26.3% |
| Chileans | 22.3 /100 | #194 | Fair 26.3% |
| Immigrants | Malaysia | 22.2 /100 | #195 | Fair 26.3% |
| Immigrants | Western Asia | 21.7 /100 | #196 | Fair 26.3% |
| Zimbabweans | 21.6 /100 | #197 | Fair 26.3% |
| Venezuelans | 21.5 /100 | #198 | Fair 26.3% |
| Dutch West Indians | 21.0 /100 | #199 | Fair 26.3% |
| Delaware | 20.9 /100 | #200 | Fair 26.3% |
| Immigrants | Syria | 19.3 /100 | #201 | Poor 26.4% |
| Laotians | 19.2 /100 | #202 | Poor 26.4% |
| Immigrants | Eastern Europe | 19.2 /100 | #203 | Poor 26.4% |
| Immigrants | Russia | 19.0 /100 | #204 | Poor 26.4% |
| Immigrants | Southern Europe | 17.3 /100 | #205 | Poor 26.4% |
Demographics Similar to Pennsylvania Germans by Wage/Income Gap
In terms of wage/income gap, the demographic groups most similar to Pennsylvania Germans are Thai (30.5%, a difference of 0.77%), Danish (31.0%, a difference of 0.84%), Assyrian/Chaldean/Syriac (31.0%, a difference of 0.97%), Swiss (30.0%, a difference of 2.5%), and Immigrants from India (31.5%, a difference of 2.7%).
| Demographics | Rating | Rank | Wage/Income Gap |
| Europeans | 0.0 /100 | #333 | Tragic 29.4% |
| Swedes | 0.0 /100 | #334 | Tragic 29.4% |
| Immigrants | Taiwan | 0.0 /100 | #335 | Tragic 29.5% |
| English | 0.0 /100 | #336 | Tragic 29.5% |
| Dutch | 0.0 /100 | #337 | Tragic 29.6% |
| Filipinos | 0.0 /100 | #338 | Tragic 29.7% |
| Iranians | 0.0 /100 | #339 | Tragic 29.7% |
| Swiss | 0.0 /100 | #340 | Tragic 30.0% |
| Thais | 0.0 /100 | #341 | Tragic 30.5% |
| Pennsylvania Germans | 0.0 /100 | #342 | Tragic 30.7% |
| Danes | 0.0 /100 | #343 | Tragic 31.0% |
| Assyrians/Chaldeans/Syriacs | 0.0 /100 | #344 | Tragic 31.0% |
| Immigrants | India | 0.0 /100 | #345 | Tragic 31.5% |
| Cajuns | 0.0 /100 | #346 | Tragic 33.9% |
| Houma | 0.0 /100 | #347 | Tragic 38.7% |