Immigrants from Zimbabwe vs Pakistani 6th Grade
COMPARE
Immigrants from Zimbabwe
Pakistani
6th Grade
6th Grade Comparison
Immigrants from Zimbabwe
Pakistanis
97.4%
6TH GRADE
95.0/ 100
METRIC RATING
119th/ 347
METRIC RANK
97.0%
6TH GRADE
46.0/ 100
METRIC RATING
178th/ 347
METRIC RANK
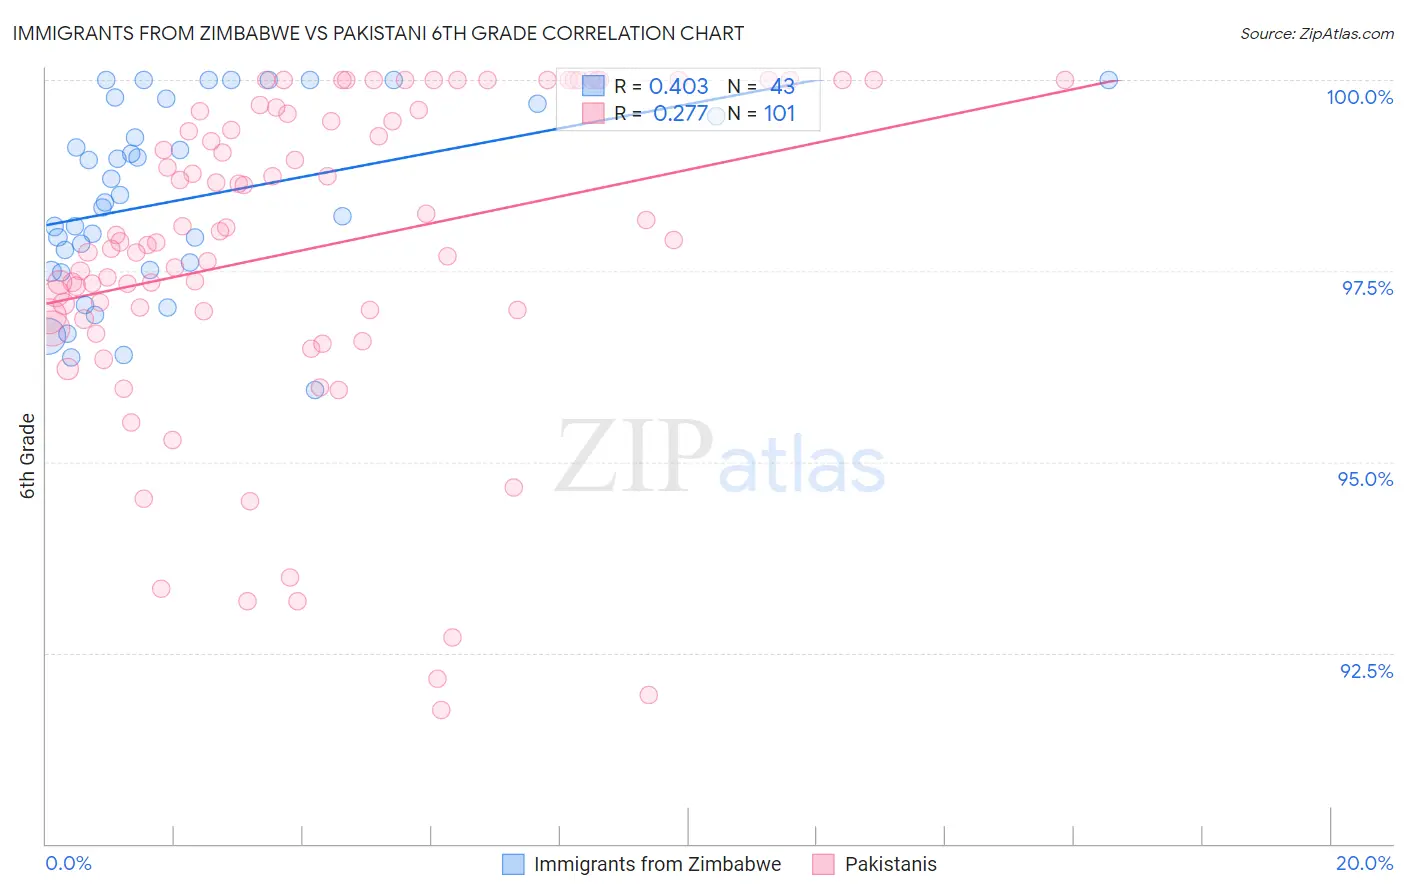
Immigrants from Zimbabwe vs Pakistani 6th Grade Correlation Chart
The statistical analysis conducted on geographies consisting of 117,756,150 people shows a moderate positive correlation between the proportion of Immigrants from Zimbabwe and percentage of population with at least 6th grade education in the United States with a correlation coefficient (R) of 0.403 and weighted average of 97.4%. Similarly, the statistical analysis conducted on geographies consisting of 335,355,370 people shows a weak positive correlation between the proportion of Pakistanis and percentage of population with at least 6th grade education in the United States with a correlation coefficient (R) of 0.277 and weighted average of 97.0%, a difference of 0.35%.
6th Grade Correlation Summary
| Measurement | Immigrants from Zimbabwe | Pakistani |
| Minimum | 95.9% | 91.8% |
| Maximum | 100.0% | 100.0% |
| Range | 4.1% | 8.2% |
| Mean | 98.4% | 97.8% |
| Median | 98.4% | 97.9% |
| Interquartile 25% (IQ1) | 97.5% | 96.9% |
| Interquartile 75% (IQ3) | 99.7% | 99.6% |
| Interquartile Range (IQR) | 2.2% | 2.7% |
| Standard Deviation (Sample) | 1.2% | 2.1% |
| Standard Deviation (Population) | 1.2% | 2.1% |
Similar Demographics by 6th Grade
Demographics Similar to Immigrants from Zimbabwe by 6th Grade
In terms of 6th grade, the demographic groups most similar to Immigrants from Zimbabwe are Syrian (97.4%, a difference of 0.0%), Lebanese (97.4%, a difference of 0.010%), Basque (97.4%, a difference of 0.010%), Immigrants from Japan (97.4%, a difference of 0.010%), and Immigrants from Norway (97.4%, a difference of 0.010%).
| Demographics | Rating | Rank | 6th Grade |
| Immigrants | Latvia | 96.7 /100 | #112 | Exceptional 97.4% |
| Immigrants | Saudi Arabia | 96.5 /100 | #113 | Exceptional 97.4% |
| Colville | 96.4 /100 | #114 | Exceptional 97.4% |
| Immigrants | Switzerland | 95.7 /100 | #115 | Exceptional 97.4% |
| Lebanese | 95.5 /100 | #116 | Exceptional 97.4% |
| Basques | 95.4 /100 | #117 | Exceptional 97.4% |
| Immigrants | Japan | 95.2 /100 | #118 | Exceptional 97.4% |
| Immigrants | Zimbabwe | 95.0 /100 | #119 | Exceptional 97.4% |
| Syrians | 94.8 /100 | #120 | Exceptional 97.4% |
| Immigrants | Norway | 94.7 /100 | #121 | Exceptional 97.4% |
| Immigrants | France | 94.5 /100 | #122 | Exceptional 97.4% |
| Hmong | 94.4 /100 | #123 | Exceptional 97.4% |
| Okinawans | 94.2 /100 | #124 | Exceptional 97.4% |
| Spanish | 93.7 /100 | #125 | Exceptional 97.3% |
| Immigrants | Bulgaria | 93.6 /100 | #126 | Exceptional 97.3% |
Demographics Similar to Pakistanis by 6th Grade
In terms of 6th grade, the demographic groups most similar to Pakistanis are Mongolian (97.0%, a difference of 0.0%), Immigrants from Kenya (97.0%, a difference of 0.0%), Immigrants from Kazakhstan (97.0%, a difference of 0.010%), Immigrants from Micronesia (97.0%, a difference of 0.010%), and Egyptian (97.1%, a difference of 0.020%).
| Demographics | Rating | Rank | 6th Grade |
| Immigrants | Sri Lanka | 51.7 /100 | #171 | Average 97.1% |
| Egyptians | 50.9 /100 | #172 | Average 97.1% |
| Arabs | 50.1 /100 | #173 | Average 97.0% |
| Venezuelans | 50.0 /100 | #174 | Average 97.0% |
| Immigrants | Kazakhstan | 47.3 /100 | #175 | Average 97.0% |
| Immigrants | Micronesia | 47.1 /100 | #176 | Average 97.0% |
| Mongolians | 46.7 /100 | #177 | Average 97.0% |
| Pakistanis | 46.0 /100 | #178 | Average 97.0% |
| Immigrants | Kenya | 45.3 /100 | #179 | Average 97.0% |
| Immigrants | Spain | 39.9 /100 | #180 | Fair 97.0% |
| Comanche | 37.9 /100 | #181 | Fair 97.0% |
| Immigrants | Ukraine | 35.6 /100 | #182 | Fair 97.0% |
| Immigrants | Venezuela | 34.5 /100 | #183 | Fair 97.0% |
| Spanish Americans | 33.5 /100 | #184 | Fair 97.0% |
| Argentineans | 33.0 /100 | #185 | Fair 97.0% |