Scottish vs Immigrants from Denmark Median Earnings
COMPARE
Scottish
Immigrants from Denmark
Median Earnings
Median Earnings Comparison
Scottish
Immigrants from Denmark
$46,463
MEDIAN EARNINGS
51.1/ 100
METRIC RATING
171st/ 347
METRIC RANK
$53,186
MEDIAN EARNINGS
100.0/ 100
METRIC RATING
36th/ 347
METRIC RANK
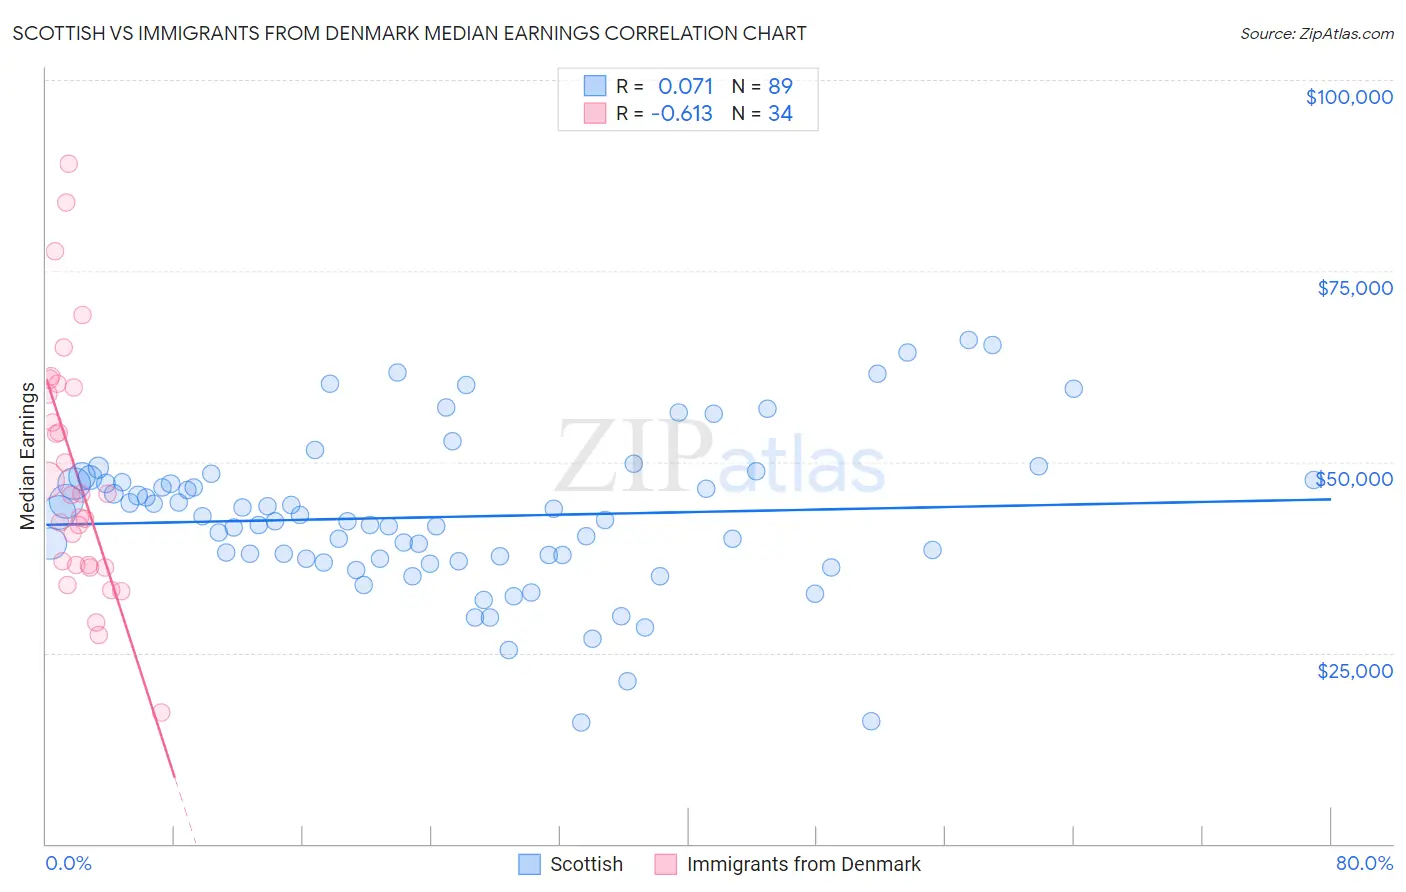
Scottish vs Immigrants from Denmark Median Earnings Correlation Chart
The statistical analysis conducted on geographies consisting of 566,727,136 people shows a slight positive correlation between the proportion of Scottish and median earnings in the United States with a correlation coefficient (R) of 0.071 and weighted average of $46,463. Similarly, the statistical analysis conducted on geographies consisting of 136,423,232 people shows a significant negative correlation between the proportion of Immigrants from Denmark and median earnings in the United States with a correlation coefficient (R) of -0.613 and weighted average of $53,186, a difference of 14.5%.
Median Earnings Correlation Summary
| Measurement | Scottish | Immigrants from Denmark |
| Minimum | $15,833 | $17,222 |
| Maximum | $65,898 | $89,094 |
| Range | $50,065 | $71,872 |
| Mean | $42,786 | $48,495 |
| Median | $42,413 | $45,741 |
| Interquartile 25% (IQ1) | $37,295 | $36,425 |
| Interquartile 75% (IQ3) | $47,447 | $59,711 |
| Interquartile Range (IQR) | $10,152 | $23,286 |
| Standard Deviation (Sample) | $10,003 | $16,233 |
| Standard Deviation (Population) | $9,946 | $15,992 |
Similar Demographics by Median Earnings
Demographics Similar to Scottish by Median Earnings
In terms of median earnings, the demographic groups most similar to Scottish are Kenyan ($46,462, a difference of 0.0%), Immigrants ($46,478, a difference of 0.030%), Ghanaian ($46,440, a difference of 0.050%), Scandinavian ($46,433, a difference of 0.060%), and Basque ($46,399, a difference of 0.14%).
| Demographics | Rating | Rank | Median Earnings |
| Norwegians | 64.7 /100 | #164 | Good $46,865 |
| South Americans | 62.7 /100 | #165 | Good $46,804 |
| Czechoslovakians | 57.8 /100 | #166 | Average $46,658 |
| Costa Ricans | 57.4 /100 | #167 | Average $46,645 |
| Immigrants | Africa | 54.6 /100 | #168 | Average $46,564 |
| Immigrants | South America | 54.0 /100 | #169 | Average $46,548 |
| Immigrants | Immigrants | 51.6 /100 | #170 | Average $46,478 |
| Scottish | 51.1 /100 | #171 | Average $46,463 |
| Kenyans | 51.0 /100 | #172 | Average $46,462 |
| Ghanaians | 50.3 /100 | #173 | Average $46,440 |
| Scandinavians | 50.0 /100 | #174 | Average $46,433 |
| Basques | 48.8 /100 | #175 | Average $46,399 |
| Danes | 48.6 /100 | #176 | Average $46,392 |
| Belgians | 48.0 /100 | #177 | Average $46,375 |
| Colombians | 47.1 /100 | #178 | Average $46,349 |
Demographics Similar to Immigrants from Denmark by Median Earnings
In terms of median earnings, the demographic groups most similar to Immigrants from Denmark are Immigrants from Switzerland ($53,211, a difference of 0.050%), Immigrants from Sri Lanka ($53,268, a difference of 0.15%), Immigrants from Greece ($53,282, a difference of 0.18%), Immigrants from Asia ($53,310, a difference of 0.23%), and Immigrants from Belarus ($53,043, a difference of 0.27%).
| Demographics | Rating | Rank | Median Earnings |
| Immigrants | Russia | 100.0 /100 | #29 | Exceptional $53,457 |
| Cambodians | 100.0 /100 | #30 | Exceptional $53,386 |
| Russians | 100.0 /100 | #31 | Exceptional $53,334 |
| Immigrants | Asia | 100.0 /100 | #32 | Exceptional $53,310 |
| Immigrants | Greece | 100.0 /100 | #33 | Exceptional $53,282 |
| Immigrants | Sri Lanka | 100.0 /100 | #34 | Exceptional $53,268 |
| Immigrants | Switzerland | 100.0 /100 | #35 | Exceptional $53,211 |
| Immigrants | Denmark | 100.0 /100 | #36 | Exceptional $53,186 |
| Immigrants | Belarus | 100.0 /100 | #37 | Exceptional $53,043 |
| Latvians | 100.0 /100 | #38 | Exceptional $53,001 |
| Immigrants | Turkey | 100.0 /100 | #39 | Exceptional $52,960 |
| Israelis | 100.0 /100 | #40 | Exceptional $52,937 |
| Immigrants | Lithuania | 100.0 /100 | #41 | Exceptional $52,769 |
| Maltese | 100.0 /100 | #42 | Exceptional $52,526 |
| Immigrants | Malaysia | 100.0 /100 | #43 | Exceptional $52,514 |