Hmong vs Immigrants from Denmark Median Earnings
COMPARE
Hmong
Immigrants from Denmark
Median Earnings
Median Earnings Comparison
Hmong
Immigrants from Denmark
$42,111
MEDIAN EARNINGS
0.2/ 100
METRIC RATING
280th/ 347
METRIC RANK
$53,186
MEDIAN EARNINGS
100.0/ 100
METRIC RATING
36th/ 347
METRIC RANK
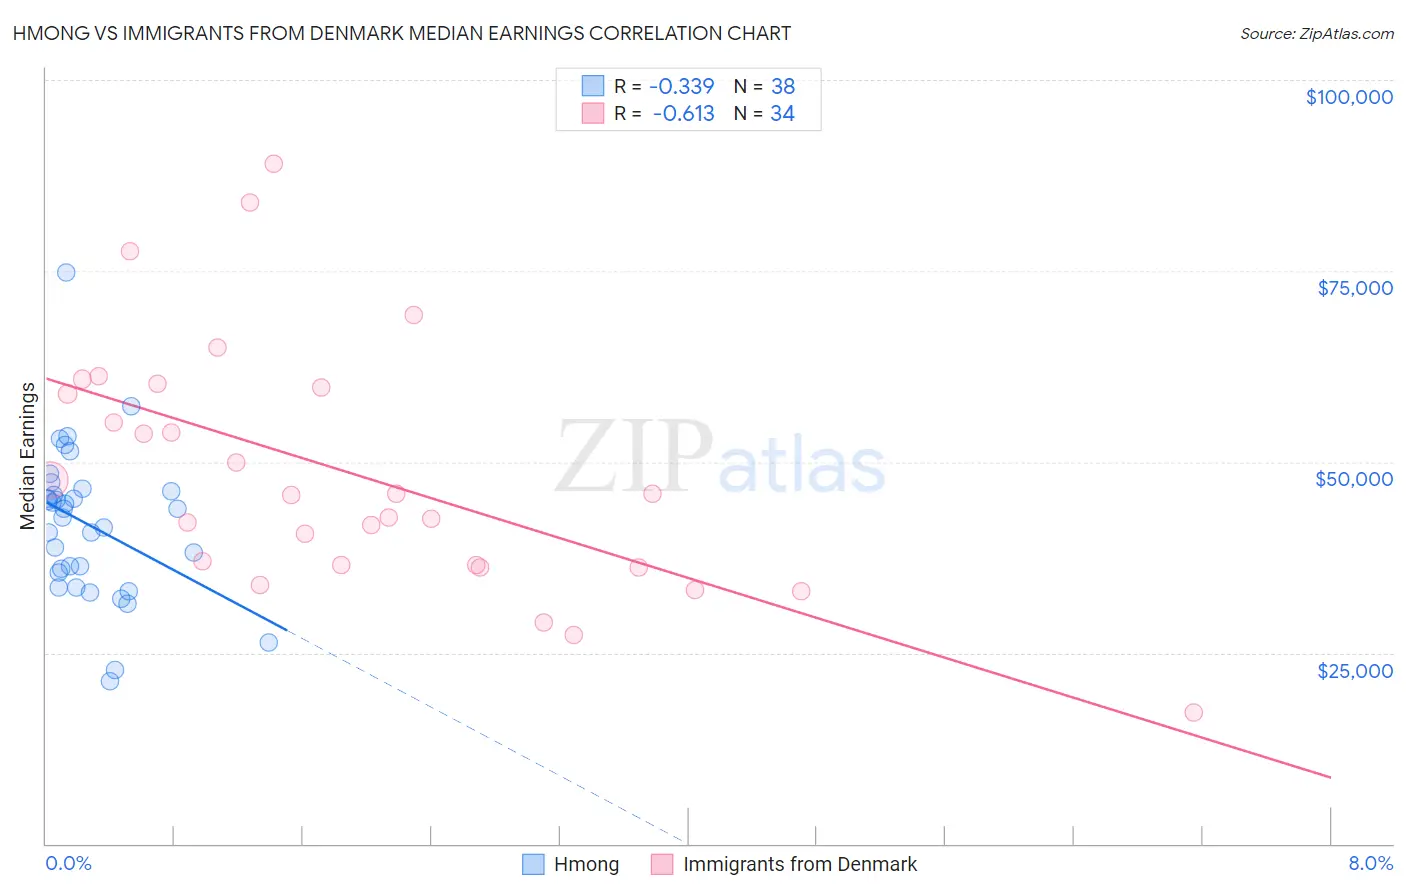
Hmong vs Immigrants from Denmark Median Earnings Correlation Chart
The statistical analysis conducted on geographies consisting of 24,671,308 people shows a mild negative correlation between the proportion of Hmong and median earnings in the United States with a correlation coefficient (R) of -0.339 and weighted average of $42,111. Similarly, the statistical analysis conducted on geographies consisting of 136,423,232 people shows a significant negative correlation between the proportion of Immigrants from Denmark and median earnings in the United States with a correlation coefficient (R) of -0.613 and weighted average of $53,186, a difference of 26.3%.
Median Earnings Correlation Summary
| Measurement | Hmong | Immigrants from Denmark |
| Minimum | $21,250 | $17,222 |
| Maximum | $74,741 | $89,094 |
| Range | $53,491 | $71,872 |
| Mean | $41,764 | $48,495 |
| Median | $43,269 | $45,741 |
| Interquartile 25% (IQ1) | $35,451 | $36,425 |
| Interquartile 75% (IQ3) | $46,136 | $59,711 |
| Interquartile Range (IQR) | $10,685 | $23,286 |
| Standard Deviation (Sample) | $9,945 | $16,233 |
| Standard Deviation (Population) | $9,814 | $15,992 |
Similar Demographics by Median Earnings
Demographics Similar to Hmong by Median Earnings
In terms of median earnings, the demographic groups most similar to Hmong are Colville ($42,151, a difference of 0.10%), Cajun ($42,189, a difference of 0.19%), Marshallese ($41,969, a difference of 0.34%), African ($41,955, a difference of 0.37%), and Central American ($42,280, a difference of 0.40%).
| Demographics | Rating | Rank | Median Earnings |
| Immigrants | Dominica | 0.4 /100 | #273 | Tragic $42,420 |
| Immigrants | El Salvador | 0.4 /100 | #274 | Tragic $42,413 |
| Immigrants | Belize | 0.3 /100 | #275 | Tragic $42,339 |
| Spanish Americans | 0.3 /100 | #276 | Tragic $42,316 |
| Central Americans | 0.3 /100 | #277 | Tragic $42,280 |
| Cajuns | 0.3 /100 | #278 | Tragic $42,189 |
| Colville | 0.2 /100 | #279 | Tragic $42,151 |
| Hmong | 0.2 /100 | #280 | Tragic $42,111 |
| Marshallese | 0.2 /100 | #281 | Tragic $41,969 |
| Africans | 0.2 /100 | #282 | Tragic $41,955 |
| Dominicans | 0.2 /100 | #283 | Tragic $41,864 |
| Blackfeet | 0.2 /100 | #284 | Tragic $41,822 |
| Immigrants | Nicaragua | 0.1 /100 | #285 | Tragic $41,737 |
| Mexican American Indians | 0.1 /100 | #286 | Tragic $41,719 |
| Indonesians | 0.1 /100 | #287 | Tragic $41,701 |
Demographics Similar to Immigrants from Denmark by Median Earnings
In terms of median earnings, the demographic groups most similar to Immigrants from Denmark are Immigrants from Switzerland ($53,211, a difference of 0.050%), Immigrants from Sri Lanka ($53,268, a difference of 0.15%), Immigrants from Greece ($53,282, a difference of 0.18%), Immigrants from Asia ($53,310, a difference of 0.23%), and Immigrants from Belarus ($53,043, a difference of 0.27%).
| Demographics | Rating | Rank | Median Earnings |
| Immigrants | Russia | 100.0 /100 | #29 | Exceptional $53,457 |
| Cambodians | 100.0 /100 | #30 | Exceptional $53,386 |
| Russians | 100.0 /100 | #31 | Exceptional $53,334 |
| Immigrants | Asia | 100.0 /100 | #32 | Exceptional $53,310 |
| Immigrants | Greece | 100.0 /100 | #33 | Exceptional $53,282 |
| Immigrants | Sri Lanka | 100.0 /100 | #34 | Exceptional $53,268 |
| Immigrants | Switzerland | 100.0 /100 | #35 | Exceptional $53,211 |
| Immigrants | Denmark | 100.0 /100 | #36 | Exceptional $53,186 |
| Immigrants | Belarus | 100.0 /100 | #37 | Exceptional $53,043 |
| Latvians | 100.0 /100 | #38 | Exceptional $53,001 |
| Immigrants | Turkey | 100.0 /100 | #39 | Exceptional $52,960 |
| Israelis | 100.0 /100 | #40 | Exceptional $52,937 |
| Immigrants | Lithuania | 100.0 /100 | #41 | Exceptional $52,769 |
| Maltese | 100.0 /100 | #42 | Exceptional $52,526 |
| Immigrants | Malaysia | 100.0 /100 | #43 | Exceptional $52,514 |