Celtic vs Immigrants from Denmark Median Earnings
COMPARE
Celtic
Immigrants from Denmark
Median Earnings
Median Earnings Comparison
Celtics
Immigrants from Denmark
$45,732
MEDIAN EARNINGS
27.2/ 100
METRIC RATING
201st/ 347
METRIC RANK
$53,186
MEDIAN EARNINGS
100.0/ 100
METRIC RATING
36th/ 347
METRIC RANK
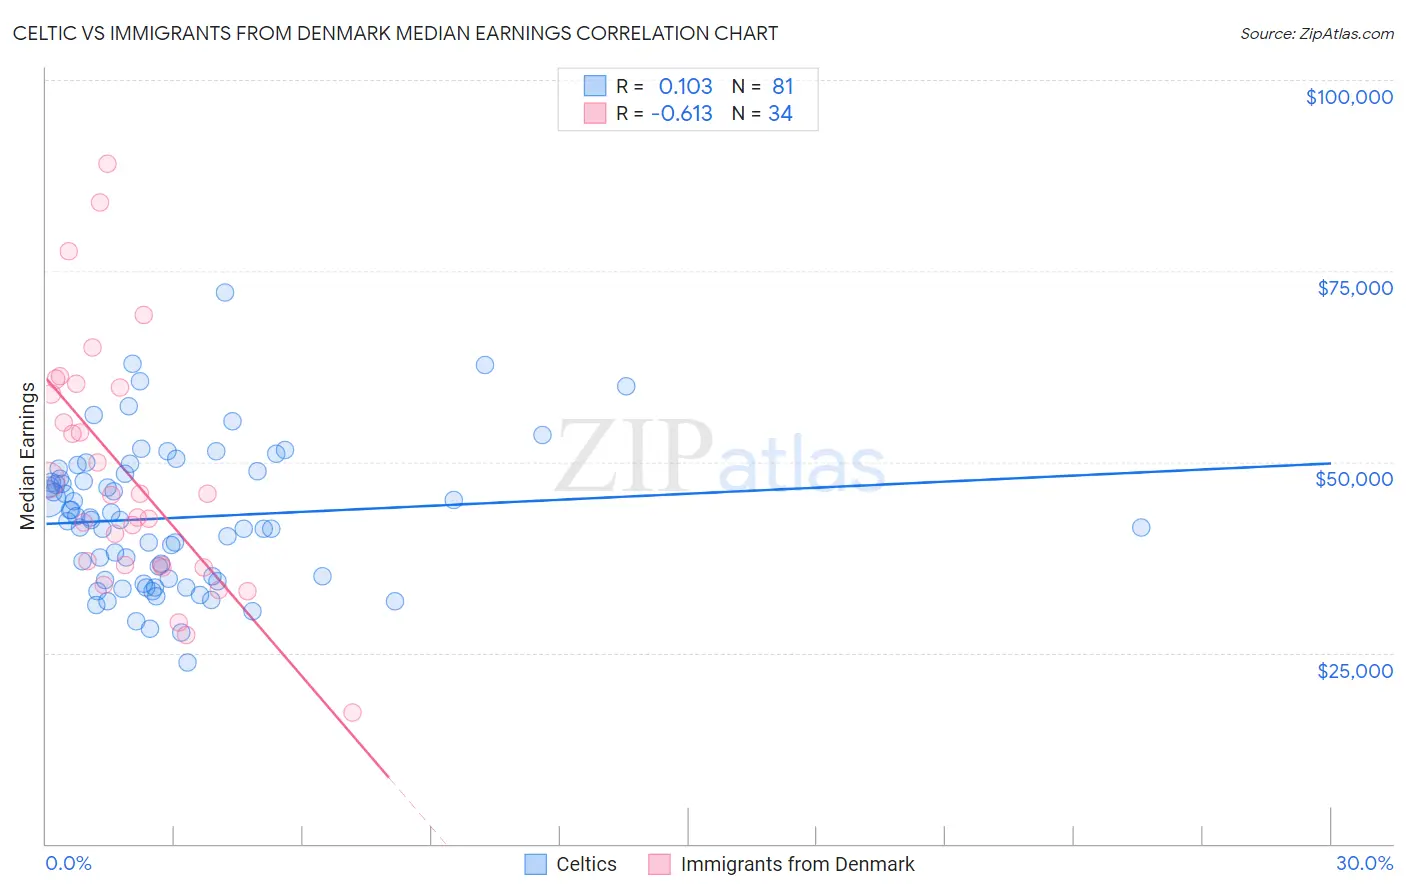
Celtic vs Immigrants from Denmark Median Earnings Correlation Chart
The statistical analysis conducted on geographies consisting of 168,867,558 people shows a poor positive correlation between the proportion of Celtics and median earnings in the United States with a correlation coefficient (R) of 0.103 and weighted average of $45,732. Similarly, the statistical analysis conducted on geographies consisting of 136,423,232 people shows a significant negative correlation between the proportion of Immigrants from Denmark and median earnings in the United States with a correlation coefficient (R) of -0.613 and weighted average of $53,186, a difference of 16.3%.
Median Earnings Correlation Summary
| Measurement | Celtic | Immigrants from Denmark |
| Minimum | $23,710 | $17,222 |
| Maximum | $72,162 | $89,094 |
| Range | $48,452 | $71,872 |
| Mean | $42,685 | $48,495 |
| Median | $42,318 | $45,741 |
| Interquartile 25% (IQ1) | $34,608 | $36,425 |
| Interquartile 75% (IQ3) | $48,561 | $59,711 |
| Interquartile Range (IQR) | $13,953 | $23,286 |
| Standard Deviation (Sample) | $9,238 | $16,233 |
| Standard Deviation (Population) | $9,181 | $15,992 |
Similar Demographics by Median Earnings
Demographics Similar to Celtics by Median Earnings
In terms of median earnings, the demographic groups most similar to Celtics are Immigrants from Trinidad and Tobago ($45,729, a difference of 0.010%), Welsh ($45,710, a difference of 0.050%), Immigrants from Uruguay ($45,682, a difference of 0.11%), Tongan ($45,665, a difference of 0.15%), and Immigrants from Barbados ($45,816, a difference of 0.18%).
| Demographics | Rating | Rank | Median Earnings |
| Immigrants | Costa Rica | 33.0 /100 | #194 | Fair $45,928 |
| Immigrants | St. Vincent and the Grenadines | 32.4 /100 | #195 | Fair $45,908 |
| Yugoslavians | 30.5 /100 | #196 | Fair $45,846 |
| Barbadians | 30.5 /100 | #197 | Fair $45,846 |
| Trinidadians and Tobagonians | 29.7 /100 | #198 | Fair $45,820 |
| Immigrants | Barbados | 29.6 /100 | #199 | Fair $45,816 |
| Immigrants | Azores | 29.5 /100 | #200 | Fair $45,812 |
| Celtics | 27.2 /100 | #201 | Fair $45,732 |
| Immigrants | Trinidad and Tobago | 27.1 /100 | #202 | Fair $45,729 |
| Welsh | 26.6 /100 | #203 | Fair $45,710 |
| Immigrants | Uruguay | 25.9 /100 | #204 | Fair $45,682 |
| Tongans | 25.4 /100 | #205 | Fair $45,665 |
| Immigrants | Ghana | 24.8 /100 | #206 | Fair $45,641 |
| Immigrants | Senegal | 24.0 /100 | #207 | Fair $45,611 |
| Immigrants | Bosnia and Herzegovina | 23.7 /100 | #208 | Fair $45,600 |
Demographics Similar to Immigrants from Denmark by Median Earnings
In terms of median earnings, the demographic groups most similar to Immigrants from Denmark are Immigrants from Switzerland ($53,211, a difference of 0.050%), Immigrants from Sri Lanka ($53,268, a difference of 0.15%), Immigrants from Greece ($53,282, a difference of 0.18%), Immigrants from Asia ($53,310, a difference of 0.23%), and Immigrants from Belarus ($53,043, a difference of 0.27%).
| Demographics | Rating | Rank | Median Earnings |
| Immigrants | Russia | 100.0 /100 | #29 | Exceptional $53,457 |
| Cambodians | 100.0 /100 | #30 | Exceptional $53,386 |
| Russians | 100.0 /100 | #31 | Exceptional $53,334 |
| Immigrants | Asia | 100.0 /100 | #32 | Exceptional $53,310 |
| Immigrants | Greece | 100.0 /100 | #33 | Exceptional $53,282 |
| Immigrants | Sri Lanka | 100.0 /100 | #34 | Exceptional $53,268 |
| Immigrants | Switzerland | 100.0 /100 | #35 | Exceptional $53,211 |
| Immigrants | Denmark | 100.0 /100 | #36 | Exceptional $53,186 |
| Immigrants | Belarus | 100.0 /100 | #37 | Exceptional $53,043 |
| Latvians | 100.0 /100 | #38 | Exceptional $53,001 |
| Immigrants | Turkey | 100.0 /100 | #39 | Exceptional $52,960 |
| Israelis | 100.0 /100 | #40 | Exceptional $52,937 |
| Immigrants | Lithuania | 100.0 /100 | #41 | Exceptional $52,769 |
| Maltese | 100.0 /100 | #42 | Exceptional $52,526 |
| Immigrants | Malaysia | 100.0 /100 | #43 | Exceptional $52,514 |