Immigrants from Pakistan vs Immigrants from Denmark Median Earnings

COMPARE

Immigrants from Pakistan
Race
Ancestry
AfghanAfricanAlaska NativeAlaskan AthabascanAlbanianAleutAlsatianAmericanApacheArabArapahoArgentineanArmenianAssyrian/Chaldean/SyriacAustralianAustrianBahamianBangladeshiBarbadianBasqueBelgianBelizeanBermudanBhutaneseBlackfeetBolivianBrazilianBritishBritish West IndianBulgarianBurmeseCajunCambodianCanadianCape VerdeanCarpatho RusynCelticCentral AmericanCentral American IndianCherokeeCheyenneChickasawChileanChineseChippewaChoctawColombianColvilleComancheCosta RicanCreeCreekCroatianCrowCubanCypriotCzechCzechoslovakianDanishDelawareDominicanDutchDutch West IndianEastern EuropeanEcuadorianEgyptianEnglishEstonianEthiopianEuropeanFijianFilipinoFinnishFrenchFrench American IndianFrench CanadianGermanGerman RussianGhanaianGreekGuamanian/ChamorroGuatemalanGuyaneseHaitianHmongHonduranHopiHoumaHungarianIcelanderIndian (Asian)IndonesianInupiatIranianIraqiIrishIroquoisIsraeliItalianJamaicanJapaneseJordanianKenyanKiowaKoreanLaotianLatvianLebaneseLiberianLithuanianLumbeeLuxembourgerMacedonianMalaysianMalteseMarshalleseMenomineeMexicanMexican American IndianMongolianMoroccanNative HawaiianNavajoNepaleseNew ZealanderNicaraguanNigerianNorthern EuropeanNorwegianOkinawanOsageOttawaPaiutePakistaniPalestinianPanamanianParaguayanPennsylvania GermanPeruvianPimaPolishPortuguesePotawatomiPuebloPuerto RicanPuget Sound SalishRomanianRussianSalvadoranSamoanScandinavianScotch-IrishScottishSeminoleSenegaleseSerbianShoshoneSierra LeoneanSiouxSlavicSlovakSloveneSomaliSouth AfricanSouth AmericanSouth American IndianSoviet UnionSpaniardSpanishSpanish AmericanSpanish American IndianSri LankanSubsaharan AfricanSudaneseSwedishSwissSyrianTaiwaneseThaiTlingit-HaidaTohono O'OdhamTonganTrinidadian and TobagonianTsimshianTurkishU.S. Virgin IslanderUgandanUkrainianUruguayanUteVenezuelanVietnameseWelshWest IndianYakamaYaquiYugoslavianYumanYup'ikZimbabwean
Immigration
NonimmigrantsImmigrantsAfghanistanAfricaAlbaniaArgentinaArmeniaAsiaAustraliaAustriaBahamasBangladeshBarbadosBelarusBelgiumBelizeBoliviaBosnia and HerzegovinaBrazilBulgariaBurma/MyanmarCabo VerdeCambodiaCameroonCanadaCaribbeanCentral AmericaChileChinaColombiaCongoCosta RicaCroatiaCubaCzechoslovakiaDominicaDominican RepublicEastern AfricaEastern AsiaEastern EuropeEcuadorEgyptEl SalvadorEnglandEritreaEthiopiaEuropeFijiFranceGermanyGhanaGreeceGrenadaGuatemalaGuyanaHaitiHondurasHong KongHungaryIndiaIndonesiaIranIraqIrelandIsraelItalyJamaicaJapanJordanKazakhstanKenyaKoreaKuwaitLaosLatin AmericaLatviaLebanonLiberiaLithuaniaMalaysiaMexicoMicronesiaMiddle AfricaMoldovaMoroccoNepalNetherlandsNicaraguaNigeriaNorth AmericaNorth MacedoniaNorthern AfricaNorthern EuropeNorwayOceaniaPakistanPanamaPeruPhilippinesPolandPortugalRomaniaRussiaSaudi ArabiaScotlandSenegalSerbiaSierra LeoneSingaporeSomaliaSouth AfricaSouth AmericaSouth Central AsiaSouth Eastern AsiaSouthern EuropeSpainSri LankaSt. Vincent and the GrenadinesSudanSwedenSwitzerlandSyriaTaiwanThailandTrinidad and TobagoTurkeyUgandaUkraineUruguayUzbekistanVenezuelaVietnamWest IndiesWestern AfricaWestern AsiaWestern EuropeYemenZaireZimbabweAzores
Immigrants from Denmark
Race
Ancestry
AfghanAfricanAlaska NativeAlaskan AthabascanAlbanianAleutAlsatianAmericanApacheArabArapahoArgentineanArmenianAssyrian/Chaldean/SyriacAustralianAustrianBahamianBangladeshiBarbadianBasqueBelgianBelizeanBermudanBhutaneseBlackfeetBolivianBrazilianBritishBritish West IndianBulgarianBurmeseCajunCambodianCanadianCape VerdeanCarpatho RusynCelticCentral AmericanCentral American IndianCherokeeCheyenneChickasawChileanChineseChippewaChoctawColombianColvilleComancheCosta RicanCreeCreekCroatianCrowCubanCypriotCzechCzechoslovakianDanishDelawareDominicanDutchDutch West IndianEastern EuropeanEcuadorianEgyptianEnglishEstonianEthiopianEuropeanFijianFilipinoFinnishFrenchFrench American IndianFrench CanadianGermanGerman RussianGhanaianGreekGuamanian/ChamorroGuatemalanGuyaneseHaitianHmongHonduranHopiHoumaHungarianIcelanderIndian (Asian)IndonesianInupiatIranianIraqiIrishIroquoisIsraeliItalianJamaicanJapaneseJordanianKenyanKiowaKoreanLaotianLatvianLebaneseLiberianLithuanianLumbeeLuxembourgerMacedonianMalaysianMalteseMarshalleseMenomineeMexicanMexican American IndianMongolianMoroccanNative HawaiianNavajoNepaleseNew ZealanderNicaraguanNigerianNorthern EuropeanNorwegianOkinawanOsageOttawaPaiutePakistaniPalestinianPanamanianParaguayanPennsylvania GermanPeruvianPimaPolishPortuguesePotawatomiPuebloPuerto RicanPuget Sound SalishRomanianRussianSalvadoranSamoanScandinavianScotch-IrishScottishSeminoleSenegaleseSerbianShoshoneSierra LeoneanSiouxSlavicSlovakSloveneSomaliSouth AfricanSouth AmericanSouth American IndianSoviet UnionSpaniardSpanishSpanish AmericanSpanish American IndianSri LankanSubsaharan AfricanSudaneseSwedishSwissSyrianTaiwaneseThaiTlingit-HaidaTohono O'OdhamTonganTrinidadian and TobagonianTsimshianTurkishU.S. Virgin IslanderUgandanUkrainianUruguayanUteVenezuelanVietnameseWelshWest IndianYakamaYaquiYugoslavianYumanYup'ikZimbabwean
Immigration
NonimmigrantsImmigrantsAfghanistanAfricaAlbaniaArgentinaArmeniaAsiaAustraliaAustriaBahamasBangladeshBarbadosBelarusBelgiumBelizeBoliviaBosnia and HerzegovinaBrazilBulgariaBurma/MyanmarCabo VerdeCambodiaCameroonCanadaCaribbeanCentral AmericaChileChinaColombiaCongoCosta RicaCroatiaCubaCzechoslovakiaDenmarkDominicaDominican RepublicEastern AfricaEastern AsiaEastern EuropeEcuadorEgyptEl SalvadorEnglandEritreaEthiopiaEuropeFijiFranceGermanyGhanaGreeceGrenadaGuatemalaGuyanaHaitiHondurasHong KongHungaryIndiaIndonesiaIranIraqIrelandIsraelItalyJamaicaJapanJordanKazakhstanKenyaKoreaKuwaitLaosLatin AmericaLatviaLebanonLiberiaLithuaniaMalaysiaMexicoMicronesiaMiddle AfricaMoldovaMoroccoNepalNetherlandsNicaraguaNigeriaNorth AmericaNorth MacedoniaNorthern AfricaNorthern EuropeNorwayOceaniaPanamaPeruPhilippinesPolandPortugalRomaniaRussiaSaudi ArabiaScotlandSenegalSerbiaSierra LeoneSingaporeSomaliaSouth AfricaSouth AmericaSouth Central AsiaSouth Eastern AsiaSouthern EuropeSpainSri LankaSt. Vincent and the GrenadinesSudanSwedenSwitzerlandSyriaTaiwanThailandTrinidad and TobagoTurkeyUgandaUkraineUruguayUzbekistanVenezuelaVietnamWest IndiesWestern AfricaWestern AsiaWestern EuropeYemenZaireZimbabweAzores
Median Earnings
Income
Poverty
Unemployment
Labor Participation
Family Structure
Vehicle Availability
Education Level
Disability

Median Earnings Comparison

Immigrants from Pakistan

Immigrants from Denmark

Exceptional
Exceptional
$51,693
MEDIAN EARNINGS
99.9/ 100
METRIC RATING
56th/ 347
METRIC RANK
$53,186
MEDIAN EARNINGS
100.0/ 100
METRIC RATING
36th/ 347
METRIC RANK

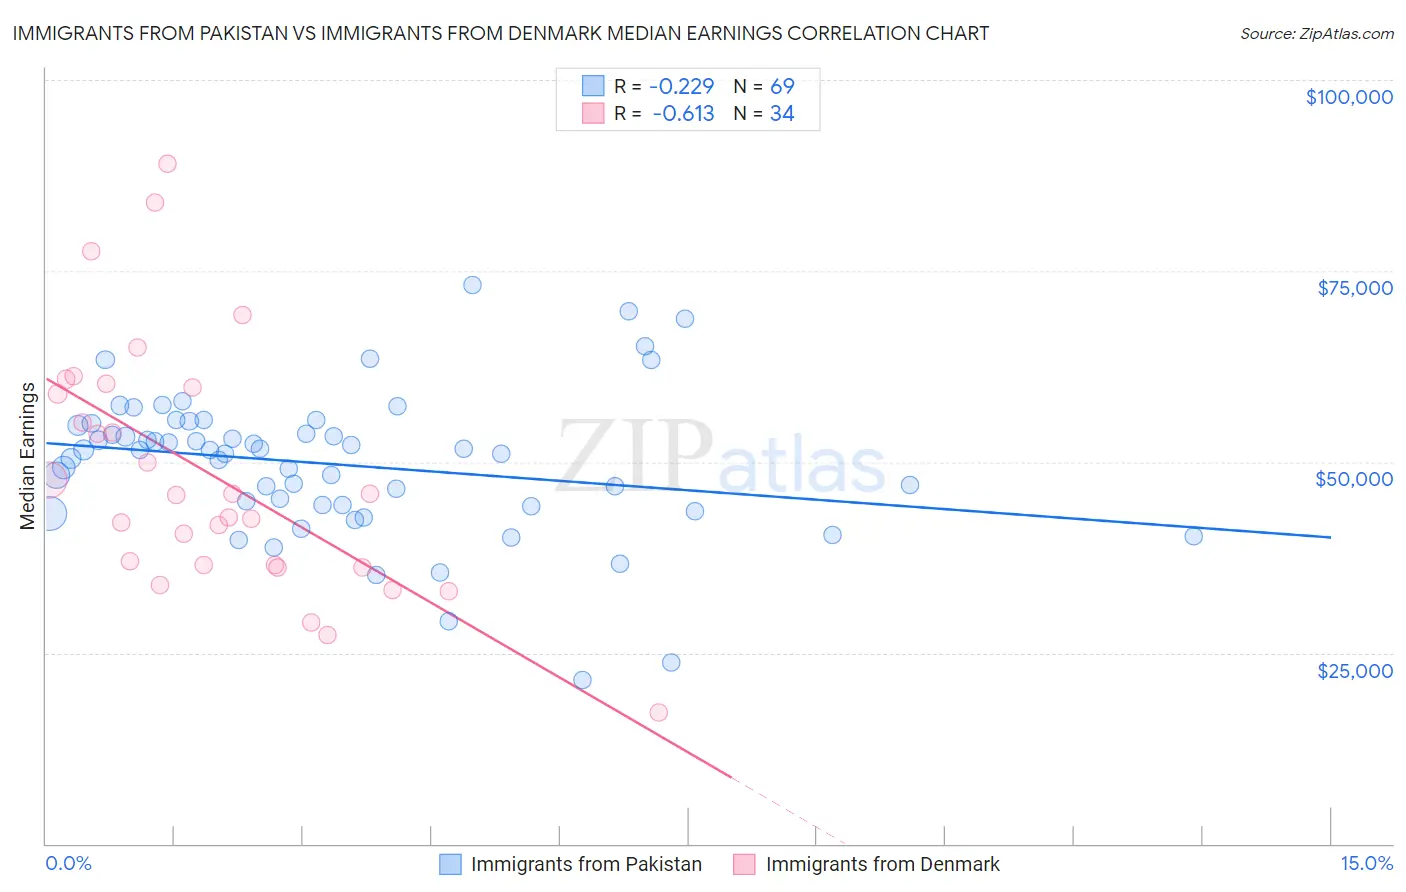
Immigrants from Pakistan vs Immigrants from Denmark Median Earnings Correlation Chart

The statistical analysis conducted on geographies consisting of 283,895,517 people shows a weak negative correlation between the proportion of Immigrants from Pakistan and median earnings in the United States with a correlation coefficient (R) of -0.229 and weighted average of $51,693. Similarly, the statistical analysis conducted on geographies consisting of 136,423,232 people shows a significant negative correlation between the proportion of Immigrants from Denmark and median earnings in the United States with a correlation coefficient (R) of -0.613 and weighted average of $53,186, a difference of 2.9%.
Immigrants from Pakistan vs Immigrants from Denmark Median Earnings

Median Earnings Correlation Summary

MeasurementImmigrants from PakistanImmigrants from Denmark
Minimum$21,371$17,222
Maximum$73,220$89,094
Range$51,849$71,872
Mean$49,677$48,495
Median$51,477$45,741
Interquartile 25% (IQ1)$44,262$36,425
Interquartile 75% (IQ3)$54,915$59,711
Interquartile Range (IQR)$10,654$23,286
Standard Deviation (Sample)$9,518$16,233
Standard Deviation (Population)$9,449$15,992

Demographics Similar to Immigrants from Pakistan and Immigrants from Denmark by Median Earnings

In terms of median earnings, the demographic groups most similar to Immigrants from Pakistan are Egyptian ($51,701, a difference of 0.010%), Immigrants from Indonesia ($51,715, a difference of 0.040%), Immigrants from Norway ($51,758, a difference of 0.13%), Estonian ($51,772, a difference of 0.15%), and Immigrants from Austria ($51,826, a difference of 0.26%). Similarly, the demographic groups most similar to Immigrants from Denmark are Immigrants from Belarus ($53,043, a difference of 0.27%), Latvian ($53,001, a difference of 0.35%), Immigrants from Turkey ($52,960, a difference of 0.43%), Israeli ($52,937, a difference of 0.47%), and Immigrants from Lithuania ($52,769, a difference of 0.79%).
DemographicsRating | RankMedian Earnings
Immigrants | Denmark
100.0
/100
|
#36
Exceptional
$53,186
Immigrants | Belarus
100.0
/100
|
#37
Exceptional
$53,043
Latvians
100.0
/100
|
#38
Exceptional
$53,001
Immigrants | Turkey
100.0
/100
|
#39
Exceptional
$52,960
Israelis
100.0
/100
|
#40
Exceptional
$52,937
Immigrants | Lithuania
100.0
/100
|
#41
Exceptional
$52,769
Maltese
100.0
/100
|
#42
Exceptional
$52,526
Immigrants | Malaysia
100.0
/100
|
#43
Exceptional
$52,514
Bulgarians
100.0
/100
|
#44
Exceptional
$52,512
Immigrants | Czechoslovakia
100.0
/100
|
#45
Exceptional
$52,361
Bhutanese
100.0
/100
|
#46
Exceptional
$52,297
Australians
100.0
/100
|
#47
Exceptional
$52,294
Immigrants | Europe
100.0
/100
|
#48
Exceptional
$52,195
Bolivians
100.0
/100
|
#49
Exceptional
$52,005
Immigrants | South Africa
100.0
/100
|
#50
Exceptional
$51,850
Immigrants | Austria
99.9
/100
|
#51
Exceptional
$51,826
Estonians
99.9
/100
|
#52
Exceptional
$51,772
Immigrants | Norway
99.9
/100
|
#53
Exceptional
$51,758
Immigrants | Indonesia
99.9
/100
|
#54
Exceptional
$51,715
Egyptians
99.9
/100
|
#55
Exceptional
$51,701
Immigrants | Pakistan
99.9
/100
|
#56
Exceptional
$51,693