Immigrants from Zaire vs Guamanian/Chamorro Householder Income Ages 45 - 64 years
COMPARE
Immigrants from Zaire
Guamanian/Chamorro
Householder Income Ages 45 - 64 years
Householder Income Ages 45 - 64 years Comparison
Immigrants from Zaire
Guamanians/Chamorros
$85,207
HOUSEHOLDER INCOME AGES 45 - 64 YEARS
0.1/ 100
METRIC RATING
296th/ 347
METRIC RANK
$101,170
HOUSEHOLDER INCOME AGES 45 - 64 YEARS
60.5/ 100
METRIC RATING
169th/ 347
METRIC RANK
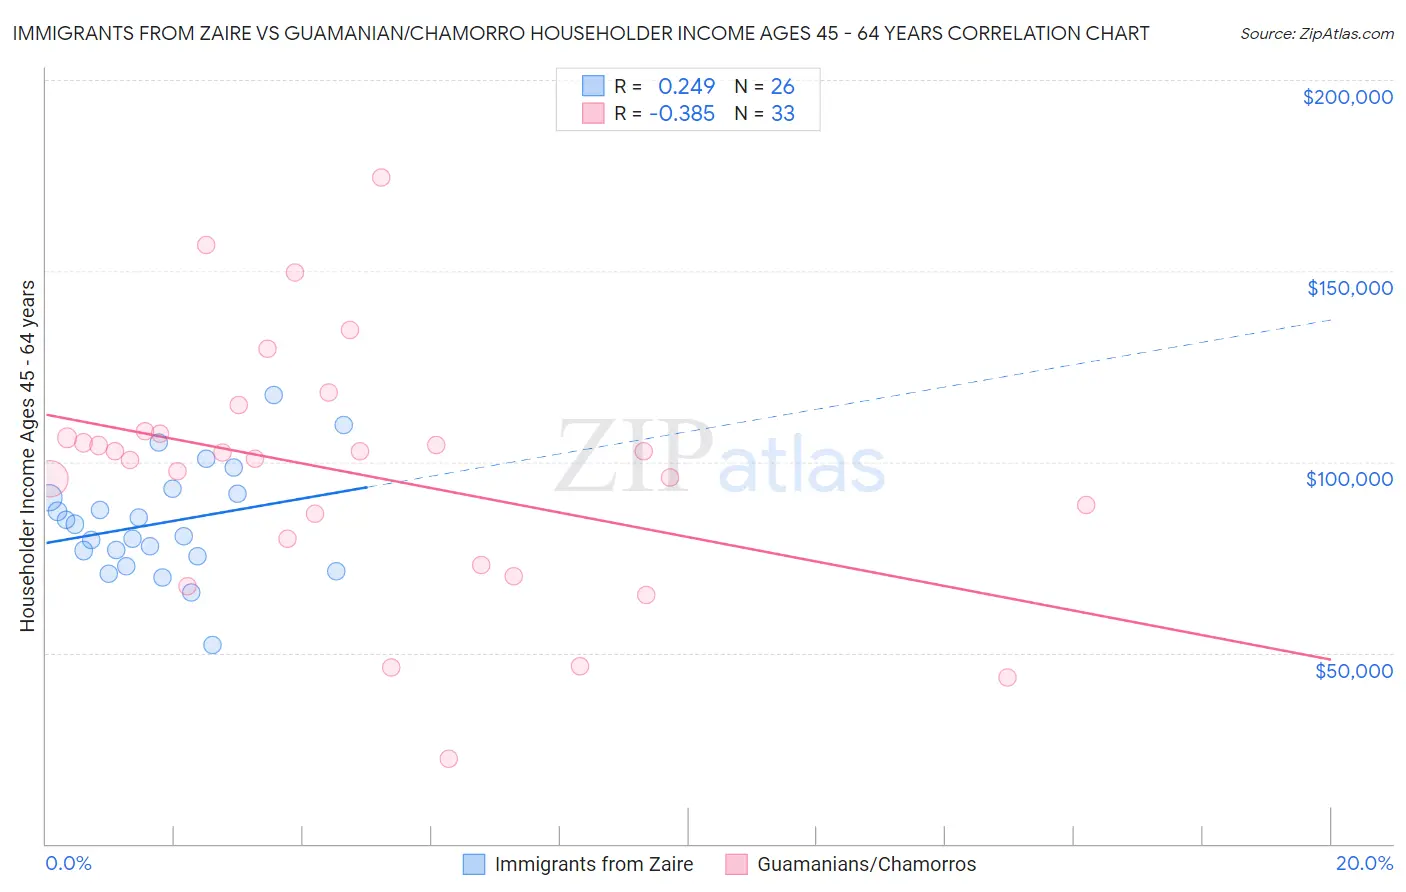
Immigrants from Zaire vs Guamanian/Chamorro Householder Income Ages 45 - 64 years Correlation Chart
The statistical analysis conducted on geographies consisting of 107,222,169 people shows a weak positive correlation between the proportion of Immigrants from Zaire and household income with householder between the ages 45 and 64 in the United States with a correlation coefficient (R) of 0.249 and weighted average of $85,207. Similarly, the statistical analysis conducted on geographies consisting of 221,751,742 people shows a mild negative correlation between the proportion of Guamanians/Chamorros and household income with householder between the ages 45 and 64 in the United States with a correlation coefficient (R) of -0.385 and weighted average of $101,170, a difference of 18.7%.
Householder Income Ages 45 - 64 years Correlation Summary
| Measurement | Immigrants from Zaire | Guamanian/Chamorro |
| Minimum | $51,937 | $22,381 |
| Maximum | $117,531 | $174,529 |
| Range | $65,594 | $152,148 |
| Mean | $84,004 | $97,072 |
| Median | $82,074 | $102,408 |
| Interquartile 25% (IQ1) | $75,184 | $76,408 |
| Interquartile 75% (IQ3) | $91,518 | $107,629 |
| Interquartile Range (IQR) | $16,334 | $31,221 |
| Standard Deviation (Sample) | $14,467 | $32,320 |
| Standard Deviation (Population) | $14,186 | $31,826 |
Similar Demographics by Householder Income Ages 45 - 64 years
Demographics Similar to Immigrants from Zaire by Householder Income Ages 45 - 64 years
In terms of householder income ages 45 - 64 years, the demographic groups most similar to Immigrants from Zaire are Fijian ($85,187, a difference of 0.020%), African ($84,925, a difference of 0.33%), Immigrants from Mexico ($84,910, a difference of 0.35%), Indonesian ($84,890, a difference of 0.37%), and Immigrants from Grenada ($85,552, a difference of 0.40%).
| Demographics | Rating | Rank | Householder Income Ages 45 - 64 years |
| Cubans | 0.1 /100 | #289 | Tragic $86,301 |
| Cherokee | 0.1 /100 | #290 | Tragic $86,125 |
| Hispanics or Latinos | 0.1 /100 | #291 | Tragic $86,006 |
| Immigrants | Central America | 0.1 /100 | #292 | Tragic $85,965 |
| Comanche | 0.1 /100 | #293 | Tragic $85,787 |
| British West Indians | 0.1 /100 | #294 | Tragic $85,571 |
| Immigrants | Grenada | 0.1 /100 | #295 | Tragic $85,552 |
| Immigrants | Zaire | 0.1 /100 | #296 | Tragic $85,207 |
| Fijians | 0.1 /100 | #297 | Tragic $85,187 |
| Africans | 0.0 /100 | #298 | Tragic $84,925 |
| Immigrants | Mexico | 0.0 /100 | #299 | Tragic $84,910 |
| Indonesians | 0.0 /100 | #300 | Tragic $84,890 |
| Potawatomi | 0.0 /100 | #301 | Tragic $84,613 |
| Haitians | 0.0 /100 | #302 | Tragic $84,384 |
| Hondurans | 0.0 /100 | #303 | Tragic $84,079 |
Demographics Similar to Guamanians/Chamorros by Householder Income Ages 45 - 64 years
In terms of householder income ages 45 - 64 years, the demographic groups most similar to Guamanians/Chamorros are South American Indian ($101,171, a difference of 0.0%), Slovak ($101,029, a difference of 0.14%), Czechoslovakian ($101,387, a difference of 0.21%), South American ($100,837, a difference of 0.33%), and Samoan ($101,580, a difference of 0.41%).
| Demographics | Rating | Rank | Householder Income Ages 45 - 64 years |
| Scottish | 71.1 /100 | #162 | Good $102,123 |
| English | 70.1 /100 | #163 | Good $102,021 |
| Immigrants | Morocco | 70.0 /100 | #164 | Good $102,015 |
| Immigrants | Albania | 69.4 /100 | #165 | Good $101,957 |
| Samoans | 65.3 /100 | #166 | Good $101,580 |
| Czechoslovakians | 63.0 /100 | #167 | Good $101,387 |
| South American Indians | 60.5 /100 | #168 | Good $101,171 |
| Guamanians/Chamorros | 60.5 /100 | #169 | Good $101,170 |
| Slovaks | 58.8 /100 | #170 | Average $101,029 |
| South Americans | 56.4 /100 | #171 | Average $100,837 |
| Immigrants | Uzbekistan | 52.5 /100 | #172 | Average $100,523 |
| Alsatians | 51.4 /100 | #173 | Average $100,435 |
| Welsh | 50.0 /100 | #174 | Average $100,322 |
| Germans | 48.8 /100 | #175 | Average $100,224 |
| Immigrants | Costa Rica | 47.7 /100 | #176 | Average $100,141 |