Immigrants from Zaire vs Guamanian/Chamorro Associate's Degree
COMPARE
Immigrants from Zaire
Guamanian/Chamorro
Associate's Degree
Associate's Degree Comparison
Immigrants from Zaire
Guamanians/Chamorros
45.0%
ASSOCIATE'S DEGREE
16.6/ 100
METRIC RATING
211th/ 347
METRIC RANK
43.8%
ASSOCIATE'S DEGREE
4.8/ 100
METRIC RATING
225th/ 347
METRIC RANK
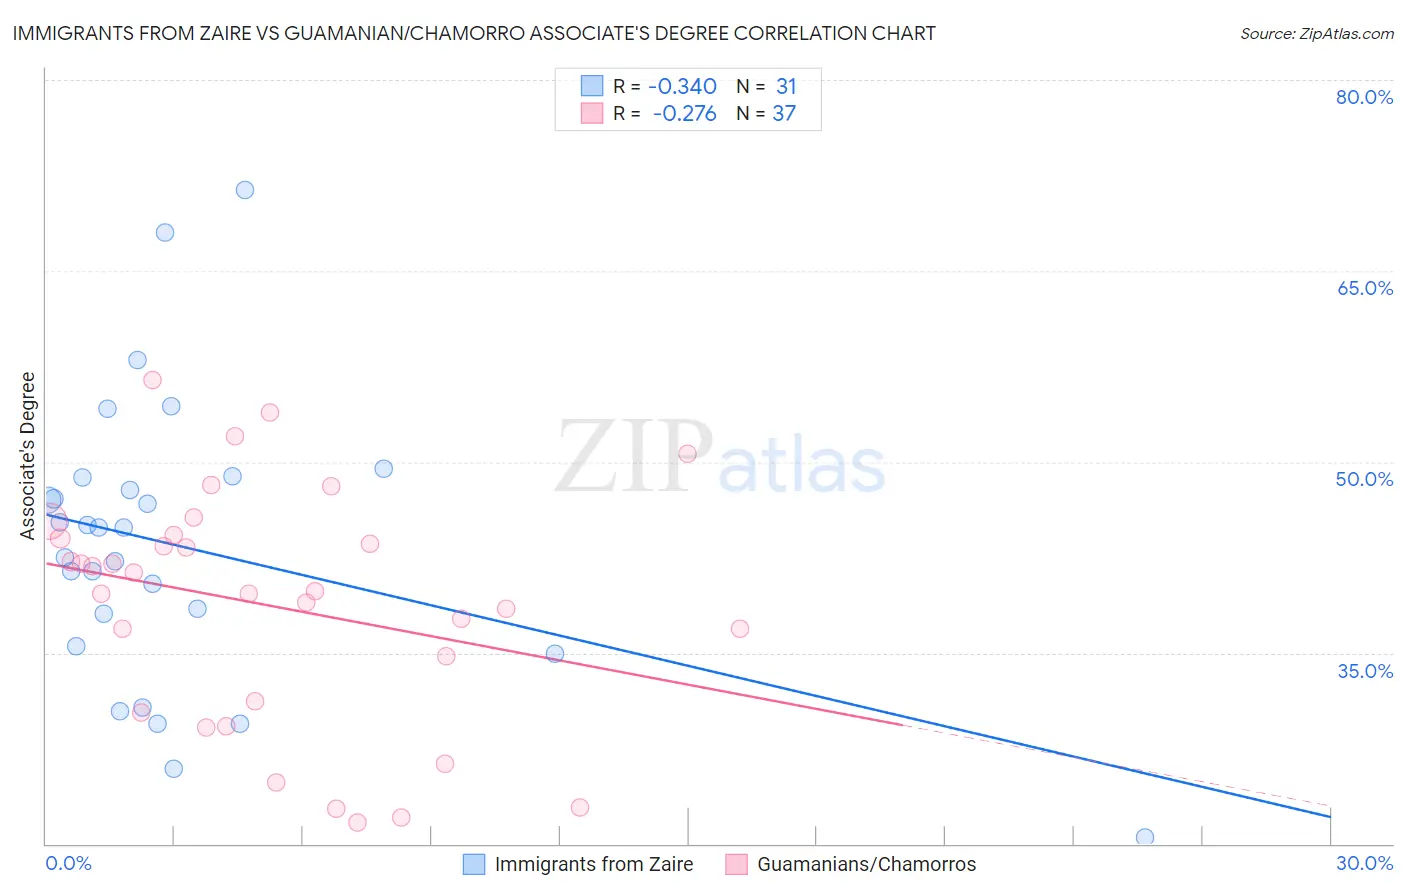
Immigrants from Zaire vs Guamanian/Chamorro Associate's Degree Correlation Chart
The statistical analysis conducted on geographies consisting of 107,255,700 people shows a mild negative correlation between the proportion of Immigrants from Zaire and percentage of population with at least associate's degree education in the United States with a correlation coefficient (R) of -0.340 and weighted average of 45.0%. Similarly, the statistical analysis conducted on geographies consisting of 221,965,027 people shows a weak negative correlation between the proportion of Guamanians/Chamorros and percentage of population with at least associate's degree education in the United States with a correlation coefficient (R) of -0.276 and weighted average of 43.8%, a difference of 2.7%.
Associate's Degree Correlation Summary
| Measurement | Immigrants from Zaire | Guamanian/Chamorro |
| Minimum | 20.5% | 21.7% |
| Maximum | 71.3% | 56.4% |
| Range | 50.8% | 34.7% |
| Mean | 43.3% | 38.7% |
| Median | 44.8% | 39.8% |
| Interquartile 25% (IQ1) | 35.5% | 30.8% |
| Interquartile 75% (IQ3) | 48.8% | 44.1% |
| Interquartile Range (IQR) | 13.3% | 13.4% |
| Standard Deviation (Sample) | 11.2% | 9.2% |
| Standard Deviation (Population) | 11.0% | 9.1% |
Demographics Similar to Immigrants from Zaire and Guamanians/Chamorros by Associate's Degree
In terms of associate's degree, the demographic groups most similar to Immigrants from Zaire are Immigrants from Costa Rica (45.0%, a difference of 0.010%), Immigrants from Philippines (45.0%, a difference of 0.010%), Dutch (45.0%, a difference of 0.13%), French Canadian (44.9%, a difference of 0.23%), and Immigrants from Ghana (44.8%, a difference of 0.35%). Similarly, the demographic groups most similar to Guamanians/Chamorros are West Indian (43.8%, a difference of 0.15%), Immigrants from Burma/Myanmar (43.7%, a difference of 0.22%), Subsaharan African (43.9%, a difference of 0.29%), Barbadian (43.9%, a difference of 0.39%), and Trinidadian and Tobagonian (43.6%, a difference of 0.39%).
| Demographics | Rating | Rank | Associate's Degree |
| Dutch | 17.6 /100 | #208 | Poor 45.0% |
| Immigrants | Costa Rica | 16.7 /100 | #209 | Poor 45.0% |
| Immigrants | Philippines | 16.7 /100 | #210 | Poor 45.0% |
| Immigrants | Zaire | 16.6 /100 | #211 | Poor 45.0% |
| French Canadians | 15.0 /100 | #212 | Poor 44.9% |
| Immigrants | Ghana | 14.2 /100 | #213 | Poor 44.8% |
| Immigrants | Middle Africa | 12.7 /100 | #214 | Poor 44.7% |
| Immigrants | Panama | 12.4 /100 | #215 | Poor 44.7% |
| Immigrants | Nigeria | 11.4 /100 | #216 | Poor 44.6% |
| Immigrants | Immigrants | 10.5 /100 | #217 | Poor 44.5% |
| Spanish | 9.4 /100 | #218 | Tragic 44.4% |
| Whites/Caucasians | 7.5 /100 | #219 | Tragic 44.2% |
| Portuguese | 7.2 /100 | #220 | Tragic 44.1% |
| Immigrants | Western Africa | 6.6 /100 | #221 | Tragic 44.1% |
| Barbadians | 5.8 /100 | #222 | Tragic 43.9% |
| Sub-Saharan Africans | 5.5 /100 | #223 | Tragic 43.9% |
| West Indians | 5.2 /100 | #224 | Tragic 43.8% |
| Guamanians/Chamorros | 4.8 /100 | #225 | Tragic 43.8% |
| Immigrants | Burma/Myanmar | 4.3 /100 | #226 | Tragic 43.7% |
| Trinidadians and Tobagonians | 4.0 /100 | #227 | Tragic 43.6% |
| Hmong | 3.2 /100 | #228 | Tragic 43.4% |