Immigrants from Eastern Asia vs Alaska Native Median Earnings
COMPARE
Immigrants from Eastern Asia
Alaska Native
Median Earnings
Median Earnings Comparison
Immigrants from Eastern Asia
Alaska Natives
$56,183
MEDIAN EARNINGS
100.0/ 100
METRIC RATING
16th/ 347
METRIC RANK
$43,750
MEDIAN EARNINGS
2.3/ 100
METRIC RATING
250th/ 347
METRIC RANK
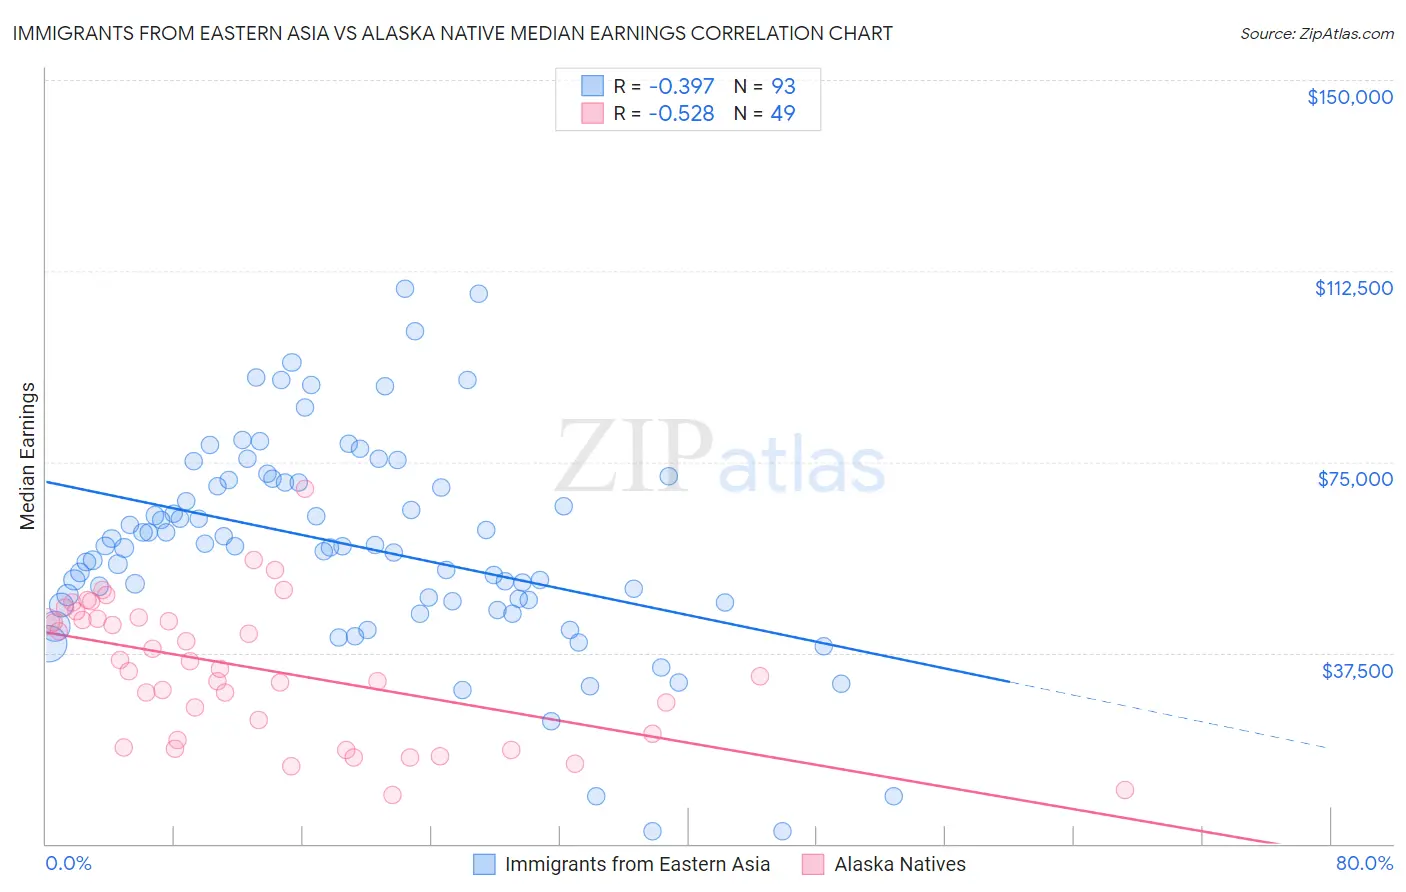
Immigrants from Eastern Asia vs Alaska Native Median Earnings Correlation Chart
The statistical analysis conducted on geographies consisting of 499,910,866 people shows a mild negative correlation between the proportion of Immigrants from Eastern Asia and median earnings in the United States with a correlation coefficient (R) of -0.397 and weighted average of $56,183. Similarly, the statistical analysis conducted on geographies consisting of 76,766,332 people shows a substantial negative correlation between the proportion of Alaska Natives and median earnings in the United States with a correlation coefficient (R) of -0.528 and weighted average of $43,750, a difference of 28.4%.
Median Earnings Correlation Summary
| Measurement | Immigrants from Eastern Asia | Alaska Native |
| Minimum | $2,499 | $9,662 |
| Maximum | $109,069 | $69,808 |
| Range | $106,570 | $60,146 |
| Mean | $58,494 | $34,396 |
| Median | $58,436 | $34,412 |
| Interquartile 25% (IQ1) | $47,510 | $20,906 |
| Interquartile 75% (IQ3) | $71,190 | $44,339 |
| Interquartile Range (IQR) | $23,680 | $23,432 |
| Standard Deviation (Sample) | $20,635 | $13,540 |
| Standard Deviation (Population) | $20,524 | $13,401 |
Similar Demographics by Median Earnings
Demographics Similar to Immigrants from Eastern Asia by Median Earnings
In terms of median earnings, the demographic groups most similar to Immigrants from Eastern Asia are Indian (Asian) ($56,253, a difference of 0.12%), Immigrants from Australia ($56,305, a difference of 0.22%), Immigrants from China ($56,638, a difference of 0.81%), Immigrants from Ireland ($56,854, a difference of 1.2%), and Immigrants from Israel ($57,034, a difference of 1.5%).
| Demographics | Rating | Rank | Median Earnings |
| Okinawans | 100.0 /100 | #9 | Exceptional $57,550 |
| Immigrants | South Central Asia | 100.0 /100 | #10 | Exceptional $57,114 |
| Immigrants | Israel | 100.0 /100 | #11 | Exceptional $57,034 |
| Immigrants | Ireland | 100.0 /100 | #12 | Exceptional $56,854 |
| Immigrants | China | 100.0 /100 | #13 | Exceptional $56,638 |
| Immigrants | Australia | 100.0 /100 | #14 | Exceptional $56,305 |
| Indians (Asian) | 100.0 /100 | #15 | Exceptional $56,253 |
| Immigrants | Eastern Asia | 100.0 /100 | #16 | Exceptional $56,183 |
| Eastern Europeans | 100.0 /100 | #17 | Exceptional $55,084 |
| Immigrants | Japan | 100.0 /100 | #18 | Exceptional $54,938 |
| Immigrants | Belgium | 100.0 /100 | #19 | Exceptional $54,679 |
| Cypriots | 100.0 /100 | #20 | Exceptional $54,589 |
| Burmese | 100.0 /100 | #21 | Exceptional $54,559 |
| Immigrants | Korea | 100.0 /100 | #22 | Exceptional $54,530 |
| Immigrants | Sweden | 100.0 /100 | #23 | Exceptional $54,478 |
Demographics Similar to Alaska Natives by Median Earnings
In terms of median earnings, the demographic groups most similar to Alaska Natives are Tsimshian ($43,695, a difference of 0.13%), Hawaiian ($43,673, a difference of 0.18%), Malaysian ($43,844, a difference of 0.22%), Nepalese ($43,860, a difference of 0.25%), and Somali ($43,567, a difference of 0.42%).
| Demographics | Rating | Rank | Median Earnings |
| Sub-Saharan Africans | 3.7 /100 | #243 | Tragic $44,118 |
| Immigrants | Nonimmigrants | 3.7 /100 | #244 | Tragic $44,117 |
| Immigrants | Burma/Myanmar | 3.2 /100 | #245 | Tragic $43,998 |
| Immigrants | West Indies | 3.1 /100 | #246 | Tragic $43,989 |
| Immigrants | Cabo Verde | 3.0 /100 | #247 | Tragic $43,963 |
| Nepalese | 2.6 /100 | #248 | Tragic $43,860 |
| Malaysians | 2.6 /100 | #249 | Tragic $43,844 |
| Alaska Natives | 2.3 /100 | #250 | Tragic $43,750 |
| Tsimshian | 2.1 /100 | #251 | Tragic $43,695 |
| Hawaiians | 2.0 /100 | #252 | Tragic $43,673 |
| Somalis | 1.8 /100 | #253 | Tragic $43,567 |
| Liberians | 1.7 /100 | #254 | Tragic $43,536 |
| Immigrants | Middle Africa | 1.4 /100 | #255 | Tragic $43,416 |
| Alaskan Athabascans | 1.4 /100 | #256 | Tragic $43,393 |
| Jamaicans | 1.3 /100 | #257 | Tragic $43,343 |