Sioux vs Alaska Native Median Earnings

COMPARE

Sioux
Race
Ancestry
AfghanAfricanAlaskan AthabascanAlbanianAleutAlsatianAmericanApacheArabArapahoArgentineanArmenianAssyrian/Chaldean/SyriacAustralianAustrianBahamianBangladeshiBarbadianBasqueBelgianBelizeanBermudanBhutaneseBlackfeetBolivianBrazilianBritishBritish West IndianBulgarianBurmeseCajunCambodianCanadianCape VerdeanCarpatho RusynCelticCentral AmericanCentral American IndianCherokeeCheyenneChickasawChileanChineseChippewaChoctawColombianColvilleComancheCosta RicanCreeCreekCroatianCrowCubanCypriotCzechCzechoslovakianDanishDelawareDominicanDutchDutch West IndianEastern EuropeanEcuadorianEgyptianEnglishEstonianEthiopianEuropeanFijianFilipinoFinnishFrenchFrench American IndianFrench CanadianGermanGerman RussianGhanaianGreekGuamanian/ChamorroGuatemalanGuyaneseHaitianHmongHonduranHopiHoumaHungarianIcelanderIndian (Asian)IndonesianInupiatIranianIraqiIrishIroquoisIsraeliItalianJamaicanJapaneseJordanianKenyanKiowaKoreanLaotianLatvianLebaneseLiberianLithuanianLumbeeLuxembourgerMacedonianMalaysianMalteseMarshalleseMenomineeMexicanMexican American IndianMongolianMoroccanNative HawaiianNavajoNepaleseNew ZealanderNicaraguanNigerianNorthern EuropeanNorwegianOkinawanOsageOttawaPaiutePakistaniPalestinianPanamanianParaguayanPennsylvania GermanPeruvianPimaPolishPortuguesePotawatomiPuebloPuerto RicanPuget Sound SalishRomanianRussianSalvadoranSamoanScandinavianScotch-IrishScottishSeminoleSenegaleseSerbianShoshoneSierra LeoneanSiouxSlavicSlovakSloveneSomaliSouth AfricanSouth AmericanSouth American IndianSoviet UnionSpaniardSpanishSpanish AmericanSpanish American IndianSri LankanSubsaharan AfricanSudaneseSwedishSwissSyrianTaiwaneseThaiTlingit-HaidaTohono O'OdhamTonganTrinidadian and TobagonianTsimshianTurkishU.S. Virgin IslanderUgandanUkrainianUruguayanUteVenezuelanVietnameseWelshWest IndianYakamaYaquiYugoslavianYumanYup'ikZimbabwean
Immigration
NonimmigrantsImmigrantsAfghanistanAfricaAlbaniaArgentinaArmeniaAsiaAustraliaAustriaBahamasBangladeshBarbadosBelarusBelgiumBelizeBoliviaBosnia and HerzegovinaBrazilBulgariaBurma/MyanmarCabo VerdeCambodiaCameroonCanadaCaribbeanCentral AmericaChileChinaColombiaCongoCosta RicaCroatiaCubaCzechoslovakiaDenmarkDominicaDominican RepublicEastern AfricaEastern AsiaEastern EuropeEcuadorEgyptEl SalvadorEnglandEritreaEthiopiaEuropeFijiFranceGermanyGhanaGreeceGrenadaGuatemalaGuyanaHaitiHondurasHong KongHungaryIndiaIndonesiaIranIraqIrelandIsraelItalyJamaicaJapanJordanKazakhstanKenyaKoreaKuwaitLaosLatin AmericaLatviaLebanonLiberiaLithuaniaMalaysiaMexicoMicronesiaMiddle AfricaMoldovaMoroccoNepalNetherlandsNicaraguaNigeriaNorth AmericaNorth MacedoniaNorthern AfricaNorthern EuropeNorwayOceaniaPakistanPanamaPeruPhilippinesPolandPortugalRomaniaRussiaSaudi ArabiaScotlandSenegalSerbiaSierra LeoneSingaporeSomaliaSouth AfricaSouth AmericaSouth Central AsiaSouth Eastern AsiaSouthern EuropeSpainSri LankaSt. Vincent and the GrenadinesSudanSwedenSwitzerlandSyriaTaiwanThailandTrinidad and TobagoTurkeyUgandaUkraineUruguayUzbekistanVenezuelaVietnamWest IndiesWestern AfricaWestern AsiaWestern EuropeYemenZaireZimbabweAzores
Alaska Native
Race
Ancestry
AfghanAfricanAlaska NativeAlaskan AthabascanAlbanianAleutAlsatianAmericanApacheArabArapahoArgentineanArmenianAssyrian/Chaldean/SyriacAustralianAustrianBahamianBangladeshiBarbadianBasqueBelgianBelizeanBermudanBhutaneseBlackfeetBolivianBrazilianBritishBritish West IndianBulgarianBurmeseCajunCambodianCanadianCape VerdeanCarpatho RusynCelticCentral AmericanCentral American IndianCherokeeCheyenneChickasawChileanChineseChippewaChoctawColombianColvilleComancheCosta RicanCreeCreekCroatianCrowCubanCypriotCzechCzechoslovakianDanishDelawareDominicanDutchDutch West IndianEastern EuropeanEcuadorianEgyptianEnglishEstonianEthiopianEuropeanFijianFilipinoFinnishFrenchFrench American IndianFrench CanadianGermanGerman RussianGhanaianGreekGuamanian/ChamorroGuatemalanGuyaneseHaitianHmongHonduranHopiHoumaHungarianIcelanderIndian (Asian)IndonesianInupiatIranianIraqiIrishIroquoisIsraeliItalianJamaicanJapaneseJordanianKenyanKiowaKoreanLaotianLatvianLebaneseLiberianLithuanianLumbeeLuxembourgerMacedonianMalaysianMalteseMarshalleseMenomineeMexicanMexican American IndianMongolianMoroccanNative HawaiianNavajoNepaleseNew ZealanderNicaraguanNigerianNorthern EuropeanNorwegianOkinawanOsageOttawaPaiutePakistaniPalestinianPanamanianParaguayanPennsylvania GermanPeruvianPimaPolishPortuguesePotawatomiPuebloPuerto RicanPuget Sound SalishRomanianRussianSalvadoranSamoanScandinavianScotch-IrishScottishSeminoleSenegaleseSerbianShoshoneSierra LeoneanSlavicSlovakSloveneSomaliSouth AfricanSouth AmericanSouth American IndianSoviet UnionSpaniardSpanishSpanish AmericanSpanish American IndianSri LankanSubsaharan AfricanSudaneseSwedishSwissSyrianTaiwaneseThaiTlingit-HaidaTohono O'OdhamTonganTrinidadian and TobagonianTsimshianTurkishU.S. Virgin IslanderUgandanUkrainianUruguayanUteVenezuelanVietnameseWelshWest IndianYakamaYaquiYugoslavianYumanYup'ikZimbabwean
Immigration
NonimmigrantsImmigrantsAfghanistanAfricaAlbaniaArgentinaArmeniaAsiaAustraliaAustriaBahamasBangladeshBarbadosBelarusBelgiumBelizeBoliviaBosnia and HerzegovinaBrazilBulgariaBurma/MyanmarCabo VerdeCambodiaCameroonCanadaCaribbeanCentral AmericaChileChinaColombiaCongoCosta RicaCroatiaCubaCzechoslovakiaDenmarkDominicaDominican RepublicEastern AfricaEastern AsiaEastern EuropeEcuadorEgyptEl SalvadorEnglandEritreaEthiopiaEuropeFijiFranceGermanyGhanaGreeceGrenadaGuatemalaGuyanaHaitiHondurasHong KongHungaryIndiaIndonesiaIranIraqIrelandIsraelItalyJamaicaJapanJordanKazakhstanKenyaKoreaKuwaitLaosLatin AmericaLatviaLebanonLiberiaLithuaniaMalaysiaMexicoMicronesiaMiddle AfricaMoldovaMoroccoNepalNetherlandsNicaraguaNigeriaNorth AmericaNorth MacedoniaNorthern AfricaNorthern EuropeNorwayOceaniaPakistanPanamaPeruPhilippinesPolandPortugalRomaniaRussiaSaudi ArabiaScotlandSenegalSerbiaSierra LeoneSingaporeSomaliaSouth AfricaSouth AmericaSouth Central AsiaSouth Eastern AsiaSouthern EuropeSpainSri LankaSt. Vincent and the GrenadinesSudanSwedenSwitzerlandSyriaTaiwanThailandTrinidad and TobagoTurkeyUgandaUkraineUruguayUzbekistanVenezuelaVietnamWest IndiesWestern AfricaWestern AsiaWestern EuropeYemenZaireZimbabweAzores
Median Earnings
Income
Poverty
Unemployment
Labor Participation
Family Structure
Vehicle Availability
Education Level
Disability

Median Earnings Comparison

Sioux

Alaska Natives

Tragic
Tragic
$39,448
MEDIAN EARNINGS
0.0/ 100
METRIC RATING
328th/ 347
METRIC RANK
$43,750
MEDIAN EARNINGS
2.3/ 100
METRIC RATING
250th/ 347
METRIC RANK

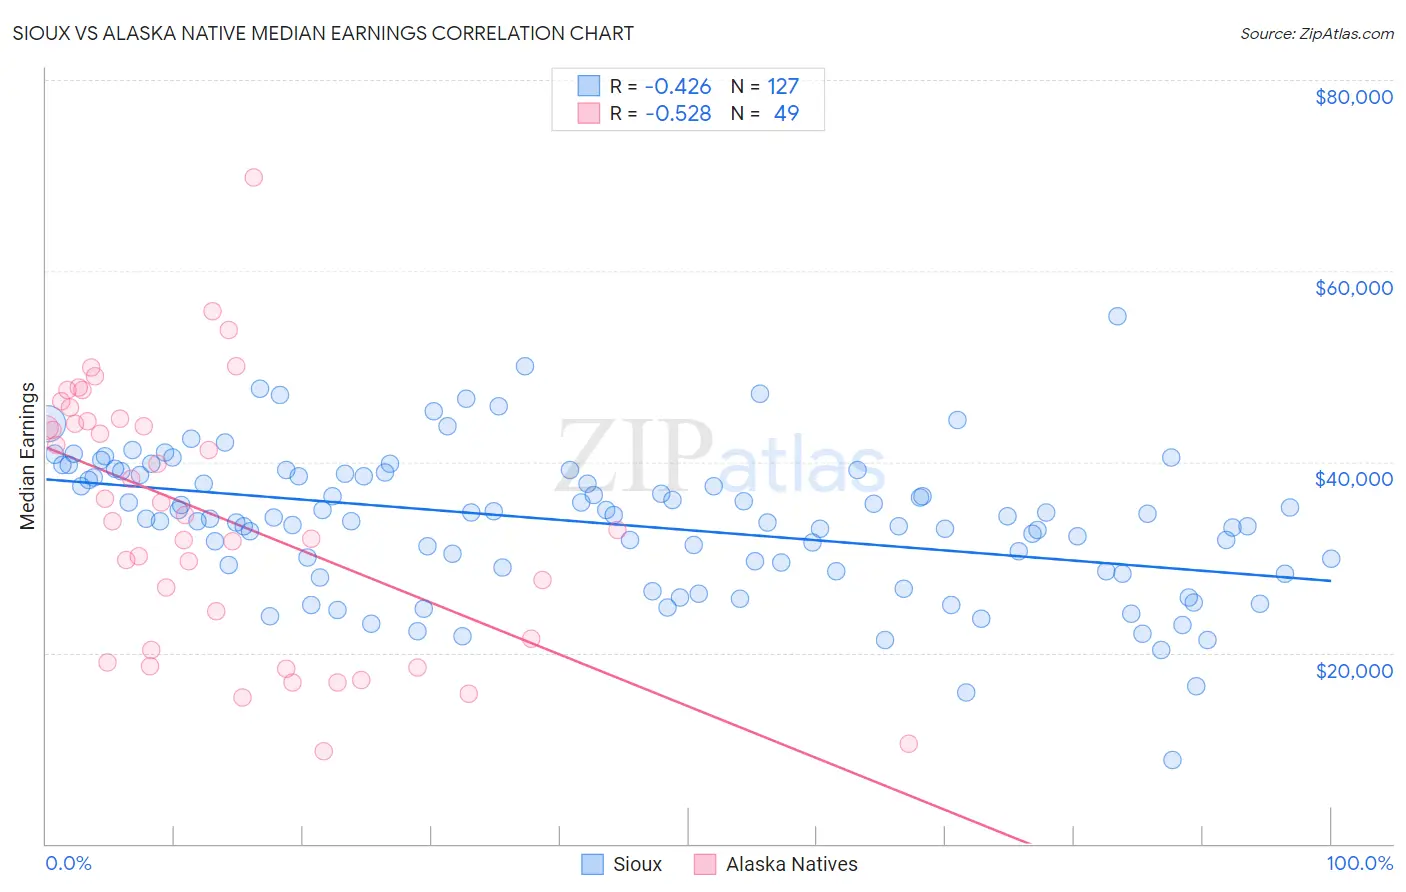
Sioux vs Alaska Native Median Earnings Correlation Chart

The statistical analysis conducted on geographies consisting of 234,180,088 people shows a moderate negative correlation between the proportion of Sioux and median earnings in the United States with a correlation coefficient (R) of -0.426 and weighted average of $39,448. Similarly, the statistical analysis conducted on geographies consisting of 76,766,332 people shows a substantial negative correlation between the proportion of Alaska Natives and median earnings in the United States with a correlation coefficient (R) of -0.528 and weighted average of $43,750, a difference of 10.9%.
Sioux vs Alaska Native Median Earnings

Median Earnings Correlation Summary

MeasurementSiouxAlaska Native
Minimum$8,827$9,662
Maximum$55,313$69,808
Range$46,486$60,146
Mean$33,596$34,396
Median$34,101$34,412
Interquartile 25% (IQ1)$28,589$20,906
Interquartile 75% (IQ3)$38,812$44,339
Interquartile Range (IQR)$10,224$23,432
Standard Deviation (Sample)$7,478$13,540
Standard Deviation (Population)$7,448$13,401

Similar Demographics by Median Earnings

Demographics Similar to Sioux by Median Earnings

In terms of median earnings, the demographic groups most similar to Sioux are Yuman ($39,523, a difference of 0.19%), Immigrants from Yemen ($39,540, a difference of 0.23%), Creek ($39,648, a difference of 0.51%), Kiowa ($39,232, a difference of 0.55%), and Ottawa ($39,721, a difference of 0.69%).
DemographicsRating | RankMedian Earnings
Mexicans
0.0
/100
|
#321
Tragic
$39,834
Immigrants | Central America
0.0
/100
|
#322
Tragic
$39,762
Bahamians
0.0
/100
|
#323
Tragic
$39,735
Ottawa
0.0
/100
|
#324
Tragic
$39,721
Creek
0.0
/100
|
#325
Tragic
$39,648
Immigrants | Yemen
0.0
/100
|
#326
Tragic
$39,540
Yuman
0.0
/100
|
#327
Tragic
$39,523
Sioux
0.0
/100
|
#328
Tragic
$39,448
Kiowa
0.0
/100
|
#329
Tragic
$39,232
Immigrants | Congo
0.0
/100
|
#330
Tragic
$39,169
Immigrants | Mexico
0.0
/100
|
#331
Tragic
$39,114
Yakama
0.0
/100
|
#332
Tragic
$39,107
Houma
0.0
/100
|
#333
Tragic
$38,949
Spanish American Indians
0.0
/100
|
#334
Tragic
$38,907
Natives/Alaskans
0.0
/100
|
#335
Tragic
$38,896

Demographics Similar to Alaska Natives by Median Earnings

In terms of median earnings, the demographic groups most similar to Alaska Natives are Tsimshian ($43,695, a difference of 0.13%), Hawaiian ($43,673, a difference of 0.18%), Malaysian ($43,844, a difference of 0.22%), Nepalese ($43,860, a difference of 0.25%), and Somali ($43,567, a difference of 0.42%).
DemographicsRating | RankMedian Earnings
Sub-Saharan Africans
3.7
/100
|
#243
Tragic
$44,118
Immigrants | Nonimmigrants
3.7
/100
|
#244
Tragic
$44,117
Immigrants | Burma/Myanmar
3.2
/100
|
#245
Tragic
$43,998
Immigrants | West Indies
3.1
/100
|
#246
Tragic
$43,989
Immigrants | Cabo Verde
3.0
/100
|
#247
Tragic
$43,963
Nepalese
2.6
/100
|
#248
Tragic
$43,860
Malaysians
2.6
/100
|
#249
Tragic
$43,844
Alaska Natives
2.3
/100
|
#250
Tragic
$43,750
Tsimshian
2.1
/100
|
#251
Tragic
$43,695
Hawaiians
2.0
/100
|
#252
Tragic
$43,673
Somalis
1.8
/100
|
#253
Tragic
$43,567
Liberians
1.7
/100
|
#254
Tragic
$43,536
Immigrants | Middle Africa
1.4
/100
|
#255
Tragic
$43,416
Alaskan Athabascans
1.4
/100
|
#256
Tragic
$43,393
Jamaicans
1.3
/100
|
#257
Tragic
$43,343