Immigrants from Nepal vs Alaska Native Median Earnings
COMPARE
Immigrants from Nepal
Alaska Native
Median Earnings
Median Earnings Comparison
Immigrants from Nepal
Alaska Natives
$47,925
MEDIAN EARNINGS
89.0/ 100
METRIC RATING
137th/ 347
METRIC RANK
$43,750
MEDIAN EARNINGS
2.3/ 100
METRIC RATING
250th/ 347
METRIC RANK
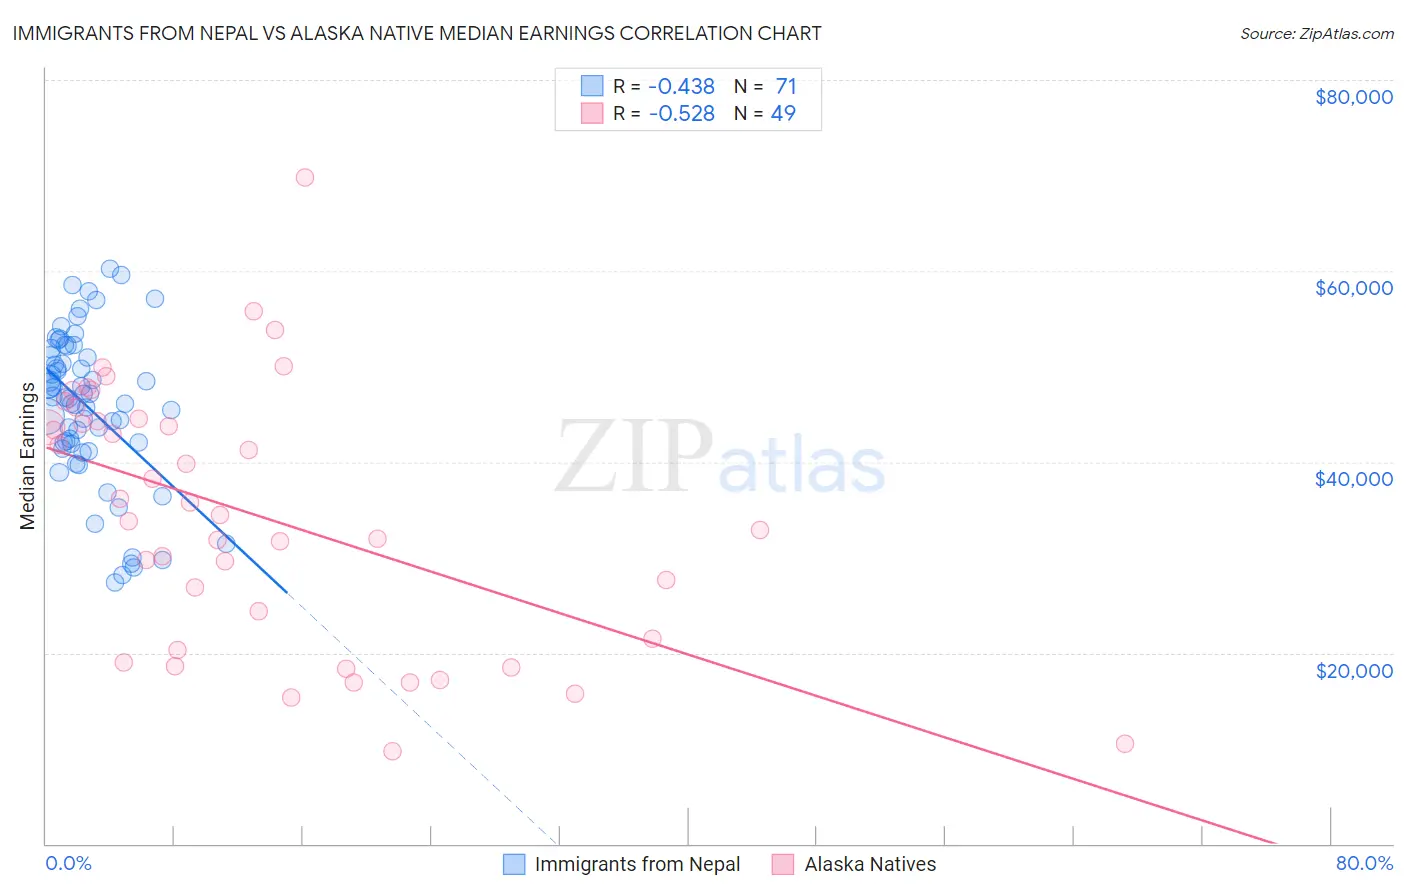
Immigrants from Nepal vs Alaska Native Median Earnings Correlation Chart
The statistical analysis conducted on geographies consisting of 186,786,511 people shows a moderate negative correlation between the proportion of Immigrants from Nepal and median earnings in the United States with a correlation coefficient (R) of -0.438 and weighted average of $47,925. Similarly, the statistical analysis conducted on geographies consisting of 76,766,332 people shows a substantial negative correlation between the proportion of Alaska Natives and median earnings in the United States with a correlation coefficient (R) of -0.528 and weighted average of $43,750, a difference of 9.5%.
Median Earnings Correlation Summary
| Measurement | Immigrants from Nepal | Alaska Native |
| Minimum | $27,307 | $9,662 |
| Maximum | $60,227 | $69,808 |
| Range | $32,920 | $60,146 |
| Mean | $45,713 | $34,396 |
| Median | $46,771 | $34,412 |
| Interquartile 25% (IQ1) | $41,930 | $20,906 |
| Interquartile 75% (IQ3) | $51,099 | $44,339 |
| Interquartile Range (IQR) | $9,169 | $23,432 |
| Standard Deviation (Sample) | $7,950 | $13,540 |
| Standard Deviation (Population) | $7,894 | $13,401 |
Similar Demographics by Median Earnings
Demographics Similar to Immigrants from Nepal by Median Earnings
In terms of median earnings, the demographic groups most similar to Immigrants from Nepal are European ($47,915, a difference of 0.020%), Canadian ($47,911, a difference of 0.030%), Taiwanese ($47,902, a difference of 0.050%), Immigrants from Sierra Leone ($47,875, a difference of 0.11%), and Slovene ($47,995, a difference of 0.15%).
| Demographics | Rating | Rank | Median Earnings |
| Zimbabweans | 92.6 /100 | #130 | Exceptional $48,229 |
| Lebanese | 92.5 /100 | #131 | Exceptional $48,226 |
| British | 92.2 /100 | #132 | Exceptional $48,189 |
| Immigrants | Uganda | 90.5 /100 | #133 | Exceptional $48,041 |
| Sri Lankans | 90.5 /100 | #134 | Exceptional $48,040 |
| Portuguese | 90.4 /100 | #135 | Exceptional $48,032 |
| Slovenes | 90.0 /100 | #136 | Excellent $47,995 |
| Immigrants | Nepal | 89.0 /100 | #137 | Excellent $47,925 |
| Europeans | 88.9 /100 | #138 | Excellent $47,915 |
| Canadians | 88.8 /100 | #139 | Excellent $47,911 |
| Taiwanese | 88.7 /100 | #140 | Excellent $47,902 |
| Immigrants | Sierra Leone | 88.3 /100 | #141 | Excellent $47,875 |
| Ugandans | 88.0 /100 | #142 | Excellent $47,854 |
| Swedes | 88.0 /100 | #143 | Excellent $47,851 |
| Hungarians | 87.1 /100 | #144 | Excellent $47,795 |
Demographics Similar to Alaska Natives by Median Earnings
In terms of median earnings, the demographic groups most similar to Alaska Natives are Tsimshian ($43,695, a difference of 0.13%), Hawaiian ($43,673, a difference of 0.18%), Malaysian ($43,844, a difference of 0.22%), Nepalese ($43,860, a difference of 0.25%), and Somali ($43,567, a difference of 0.42%).
| Demographics | Rating | Rank | Median Earnings |
| Sub-Saharan Africans | 3.7 /100 | #243 | Tragic $44,118 |
| Immigrants | Nonimmigrants | 3.7 /100 | #244 | Tragic $44,117 |
| Immigrants | Burma/Myanmar | 3.2 /100 | #245 | Tragic $43,998 |
| Immigrants | West Indies | 3.1 /100 | #246 | Tragic $43,989 |
| Immigrants | Cabo Verde | 3.0 /100 | #247 | Tragic $43,963 |
| Nepalese | 2.6 /100 | #248 | Tragic $43,860 |
| Malaysians | 2.6 /100 | #249 | Tragic $43,844 |
| Alaska Natives | 2.3 /100 | #250 | Tragic $43,750 |
| Tsimshian | 2.1 /100 | #251 | Tragic $43,695 |
| Hawaiians | 2.0 /100 | #252 | Tragic $43,673 |
| Somalis | 1.8 /100 | #253 | Tragic $43,567 |
| Liberians | 1.7 /100 | #254 | Tragic $43,536 |
| Immigrants | Middle Africa | 1.4 /100 | #255 | Tragic $43,416 |
| Alaskan Athabascans | 1.4 /100 | #256 | Tragic $43,393 |
| Jamaicans | 1.3 /100 | #257 | Tragic $43,343 |