Immigrants from Western Asia vs Immigrants from China In Labor Force | Age 25-29
COMPARE
Immigrants from Western Asia
Immigrants from China
In Labor Force | Age 25-29
In Labor Force | Age 25-29 Comparison
Immigrants from Western Asia
Immigrants from China
84.1%
IN LABOR FORCE | AGE 25-29
2.7/ 100
METRIC RATING
233rd/ 347
METRIC RANK
84.6%
IN LABOR FORCE | AGE 25-29
45.7/ 100
METRIC RATING
177th/ 347
METRIC RANK
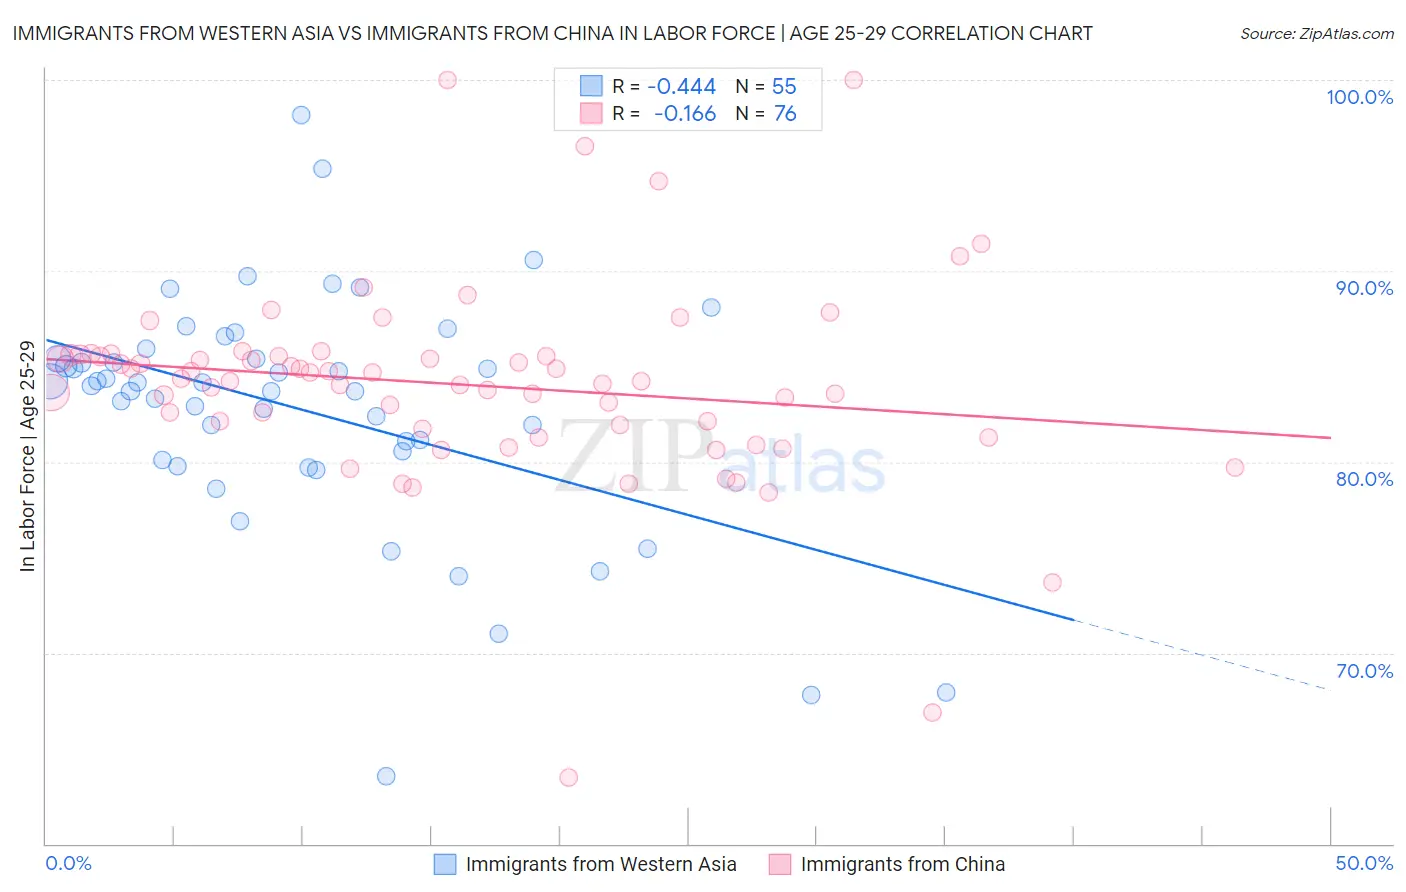
Immigrants from Western Asia vs Immigrants from China In Labor Force | Age 25-29 Correlation Chart
The statistical analysis conducted on geographies consisting of 404,303,422 people shows a moderate negative correlation between the proportion of Immigrants from Western Asia and labor force participation rate among population between the ages 25 and 29 in the United States with a correlation coefficient (R) of -0.444 and weighted average of 84.1%. Similarly, the statistical analysis conducted on geographies consisting of 456,821,208 people shows a poor negative correlation between the proportion of Immigrants from China and labor force participation rate among population between the ages 25 and 29 in the United States with a correlation coefficient (R) of -0.166 and weighted average of 84.6%, a difference of 0.63%.
In Labor Force | Age 25-29 Correlation Summary
| Measurement | Immigrants from Western Asia | Immigrants from China |
| Minimum | 63.5% | 63.5% |
| Maximum | 98.1% | 100.0% |
| Range | 34.6% | 36.5% |
| Mean | 82.7% | 84.0% |
| Median | 84.0% | 84.3% |
| Interquartile 25% (IQ1) | 80.1% | 81.8% |
| Interquartile 75% (IQ3) | 85.4% | 85.6% |
| Interquartile Range (IQR) | 5.3% | 3.7% |
| Standard Deviation (Sample) | 6.2% | 5.4% |
| Standard Deviation (Population) | 6.2% | 5.3% |
Similar Demographics by In Labor Force | Age 25-29
Demographics Similar to Immigrants from Western Asia by In Labor Force | Age 25-29
In terms of in labor force | age 25-29, the demographic groups most similar to Immigrants from Western Asia are Panamanian (84.2%, a difference of 0.10%), White/Caucasian (84.2%, a difference of 0.11%), Immigrants from Philippines (84.2%, a difference of 0.11%), Immigrants from Oceania (84.2%, a difference of 0.12%), and French American Indian (84.2%, a difference of 0.14%).
| Demographics | Rating | Rank | In Labor Force | Age 25-29 |
| Immigrants | Congo | 5.8 /100 | #226 | Tragic 84.2% |
| French American Indians | 5.5 /100 | #227 | Tragic 84.2% |
| Immigrants | Panama | 5.5 /100 | #228 | Tragic 84.2% |
| Immigrants | Oceania | 5.0 /100 | #229 | Tragic 84.2% |
| Whites/Caucasians | 4.8 /100 | #230 | Tragic 84.2% |
| Immigrants | Philippines | 4.7 /100 | #231 | Tragic 84.2% |
| Panamanians | 4.5 /100 | #232 | Tragic 84.2% |
| Immigrants | Western Asia | 2.7 /100 | #233 | Tragic 84.1% |
| Barbadians | 1.0 /100 | #234 | Tragic 83.9% |
| Iraqis | 0.9 /100 | #235 | Tragic 83.9% |
| Guamanians/Chamorros | 0.9 /100 | #236 | Tragic 83.9% |
| Immigrants | Immigrants | 0.9 /100 | #237 | Tragic 83.9% |
| Immigrants | Uzbekistan | 0.8 /100 | #238 | Tragic 83.9% |
| Jamaicans | 0.8 /100 | #239 | Tragic 83.9% |
| Trinidadians and Tobagonians | 0.7 /100 | #240 | Tragic 83.9% |
Demographics Similar to Immigrants from China by In Labor Force | Age 25-29
In terms of in labor force | age 25-29, the demographic groups most similar to Immigrants from China are Immigrants from Thailand (84.6%, a difference of 0.0%), Malaysian (84.6%, a difference of 0.010%), Immigrants from Argentina (84.6%, a difference of 0.010%), Hungarian (84.6%, a difference of 0.020%), and Immigrants from South America (84.6%, a difference of 0.020%).
| Demographics | Rating | Rank | In Labor Force | Age 25-29 |
| Tongans | 52.4 /100 | #170 | Average 84.7% |
| Immigrants | Vietnam | 50.5 /100 | #171 | Average 84.7% |
| Immigrants | Western Europe | 50.4 /100 | #172 | Average 84.7% |
| Assyrians/Chaldeans/Syriacs | 50.2 /100 | #173 | Average 84.7% |
| Palestinians | 50.0 /100 | #174 | Average 84.7% |
| Hungarians | 47.8 /100 | #175 | Average 84.6% |
| Malaysians | 46.8 /100 | #176 | Average 84.6% |
| Immigrants | China | 45.7 /100 | #177 | Average 84.6% |
| Immigrants | Thailand | 45.2 /100 | #178 | Average 84.6% |
| Immigrants | Argentina | 44.0 /100 | #179 | Average 84.6% |
| Immigrants | South America | 42.9 /100 | #180 | Average 84.6% |
| Immigrants | Norway | 41.9 /100 | #181 | Average 84.6% |
| Europeans | 40.3 /100 | #182 | Average 84.6% |
| Scottish | 40.1 /100 | #183 | Average 84.6% |
| Immigrants | Kuwait | 38.2 /100 | #184 | Fair 84.6% |