U.S. Virgin Islander vs Immigrants from China Wage/Income Gap
COMPARE
U.S. Virgin Islander
Immigrants from China
Wage/Income Gap
Wage/Income Gap Comparison
U.S. Virgin Islanders
Immigrants from China
21.5%
WAGE/INCOME GAP
100.0/ 100
METRIC RATING
45th/ 347
METRIC RANK
26.7%
WAGE/INCOME GAP
10.3/ 100
METRIC RATING
214th/ 347
METRIC RANK
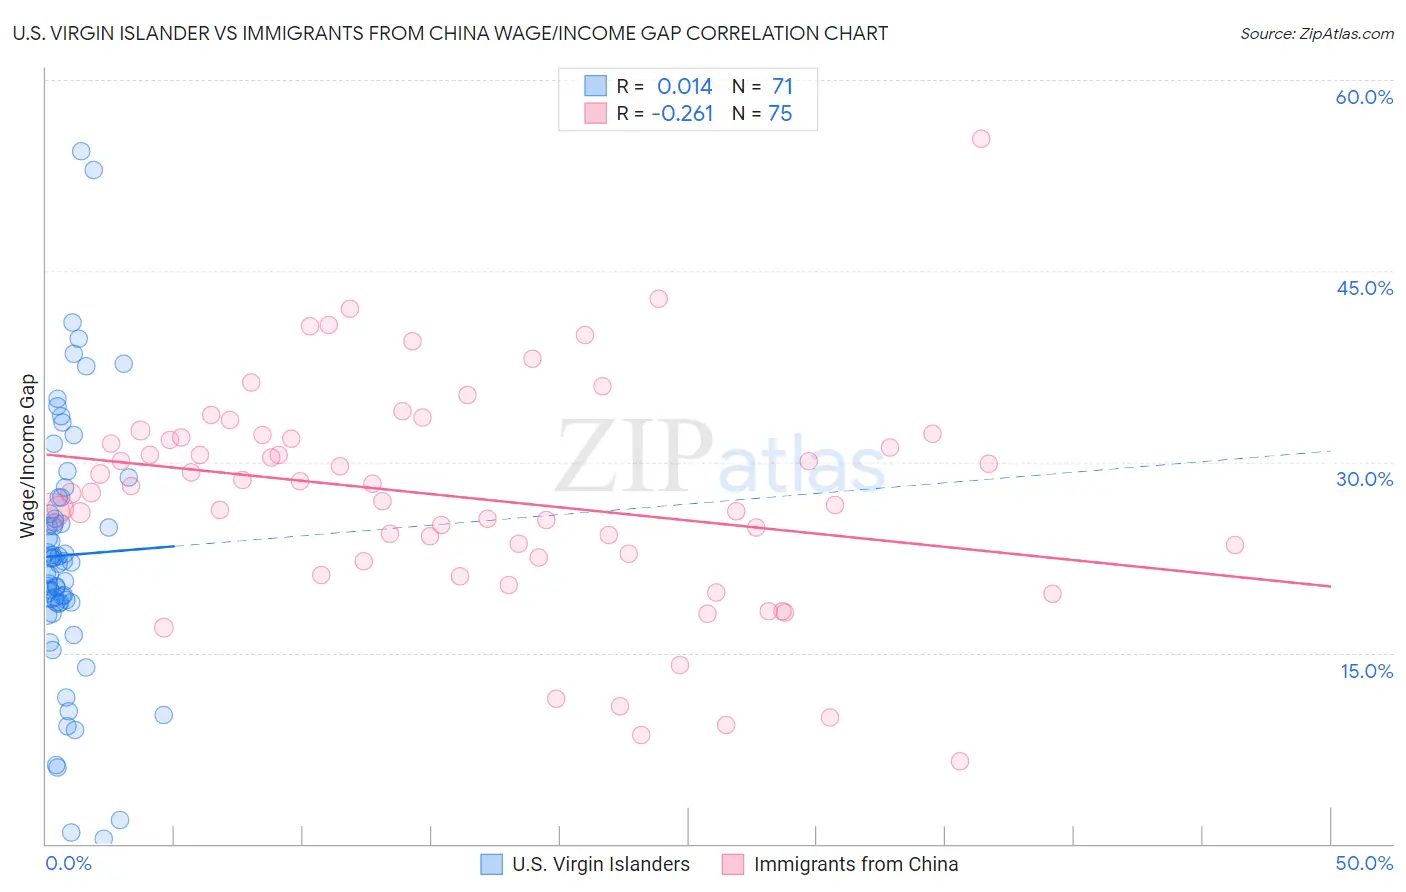
U.S. Virgin Islander vs Immigrants from China Wage/Income Gap Correlation Chart
The statistical analysis conducted on geographies consisting of 87,518,353 people shows no correlation between the proportion of U.S. Virgin Islanders and wage/income gap percentage in the United States with a correlation coefficient (R) of 0.014 and weighted average of 21.5%. Similarly, the statistical analysis conducted on geographies consisting of 456,702,733 people shows a weak negative correlation between the proportion of Immigrants from China and wage/income gap percentage in the United States with a correlation coefficient (R) of -0.261 and weighted average of 26.7%, a difference of 23.9%.
Wage/Income Gap Correlation Summary
| Measurement | U.S. Virgin Islander | Immigrants from China |
| Minimum | 0.43% | 6.5% |
| Maximum | 54.4% | 55.3% |
| Range | 54.0% | 48.9% |
| Mean | 22.7% | 27.2% |
| Median | 22.1% | 27.6% |
| Interquartile 25% (IQ1) | 18.9% | 22.4% |
| Interquartile 75% (IQ3) | 27.2% | 31.9% |
| Interquartile Range (IQR) | 8.2% | 9.5% |
| Standard Deviation (Sample) | 10.2% | 8.7% |
| Standard Deviation (Population) | 10.1% | 8.6% |
Similar Demographics by Wage/Income Gap
Demographics Similar to U.S. Virgin Islanders by Wage/Income Gap
In terms of wage/income gap, the demographic groups most similar to U.S. Virgin Islanders are Immigrants from Ethiopia (21.6%, a difference of 0.12%), Immigrants from Eritrea (21.4%, a difference of 0.44%), Sierra Leonean (21.4%, a difference of 0.46%), Liberian (21.4%, a difference of 0.52%), and Immigrants from Sierra Leone (21.4%, a difference of 0.52%).
| Demographics | Rating | Rank | Wage/Income Gap |
| Immigrants | Belize | 100.0 /100 | #38 | Exceptional 21.3% |
| Colville | 100.0 /100 | #39 | Exceptional 21.3% |
| Lumbee | 100.0 /100 | #40 | Exceptional 21.3% |
| Liberians | 100.0 /100 | #41 | Exceptional 21.4% |
| Immigrants | Sierra Leone | 100.0 /100 | #42 | Exceptional 21.4% |
| Sierra Leoneans | 100.0 /100 | #43 | Exceptional 21.4% |
| Immigrants | Eritrea | 100.0 /100 | #44 | Exceptional 21.4% |
| U.S. Virgin Islanders | 100.0 /100 | #45 | Exceptional 21.5% |
| Immigrants | Ethiopia | 100.0 /100 | #46 | Exceptional 21.6% |
| Immigrants | Congo | 100.0 /100 | #47 | Exceptional 21.7% |
| Blacks/African Americans | 100.0 /100 | #48 | Exceptional 21.7% |
| Ethiopians | 100.0 /100 | #49 | Exceptional 21.8% |
| Immigrants | Western Africa | 100.0 /100 | #50 | Exceptional 22.0% |
| Tohono O'odham | 100.0 /100 | #51 | Exceptional 22.1% |
| Immigrants | Cameroon | 100.0 /100 | #52 | Exceptional 22.2% |
Demographics Similar to Immigrants from China by Wage/Income Gap
In terms of wage/income gap, the demographic groups most similar to Immigrants from China are Immigrants from Iraq (26.7%, a difference of 0.010%), Yugoslavian (26.7%, a difference of 0.090%), Immigrants from Portugal (26.7%, a difference of 0.13%), Iraqi (26.6%, a difference of 0.16%), and Mongolian (26.6%, a difference of 0.19%).
| Demographics | Rating | Rank | Wage/Income Gap |
| Immigrants | Italy | 15.8 /100 | #207 | Poor 26.5% |
| Egyptians | 12.7 /100 | #208 | Poor 26.6% |
| Immigrants | Kuwait | 12.6 /100 | #209 | Poor 26.6% |
| Arabs | 12.3 /100 | #210 | Poor 26.6% |
| Mongolians | 11.4 /100 | #211 | Poor 26.6% |
| Iraqis | 11.2 /100 | #212 | Poor 26.6% |
| Immigrants | Iraq | 10.3 /100 | #213 | Poor 26.7% |
| Immigrants | China | 10.3 /100 | #214 | Poor 26.7% |
| Yugoslavians | 9.7 /100 | #215 | Tragic 26.7% |
| Immigrants | Portugal | 9.5 /100 | #216 | Tragic 26.7% |
| Brazilians | 9.2 /100 | #217 | Tragic 26.7% |
| Immigrants | Saudi Arabia | 9.1 /100 | #218 | Tragic 26.7% |
| Immigrants | Poland | 8.9 /100 | #219 | Tragic 26.7% |
| Immigrants | Latvia | 8.9 /100 | #220 | Tragic 26.7% |
| Immigrants | Spain | 8.5 /100 | #221 | Tragic 26.8% |