Immigrants from Western Asia vs Immigrants from China Kindergarten
COMPARE
Immigrants from Western Asia
Immigrants from China
Kindergarten
Kindergarten Comparison
Immigrants from Western Asia
Immigrants from China
97.7%
KINDERGARTEN
2.1/ 100
METRIC RATING
236th/ 347
METRIC RANK
97.4%
KINDERGARTEN
0.1/ 100
METRIC RATING
273rd/ 347
METRIC RANK
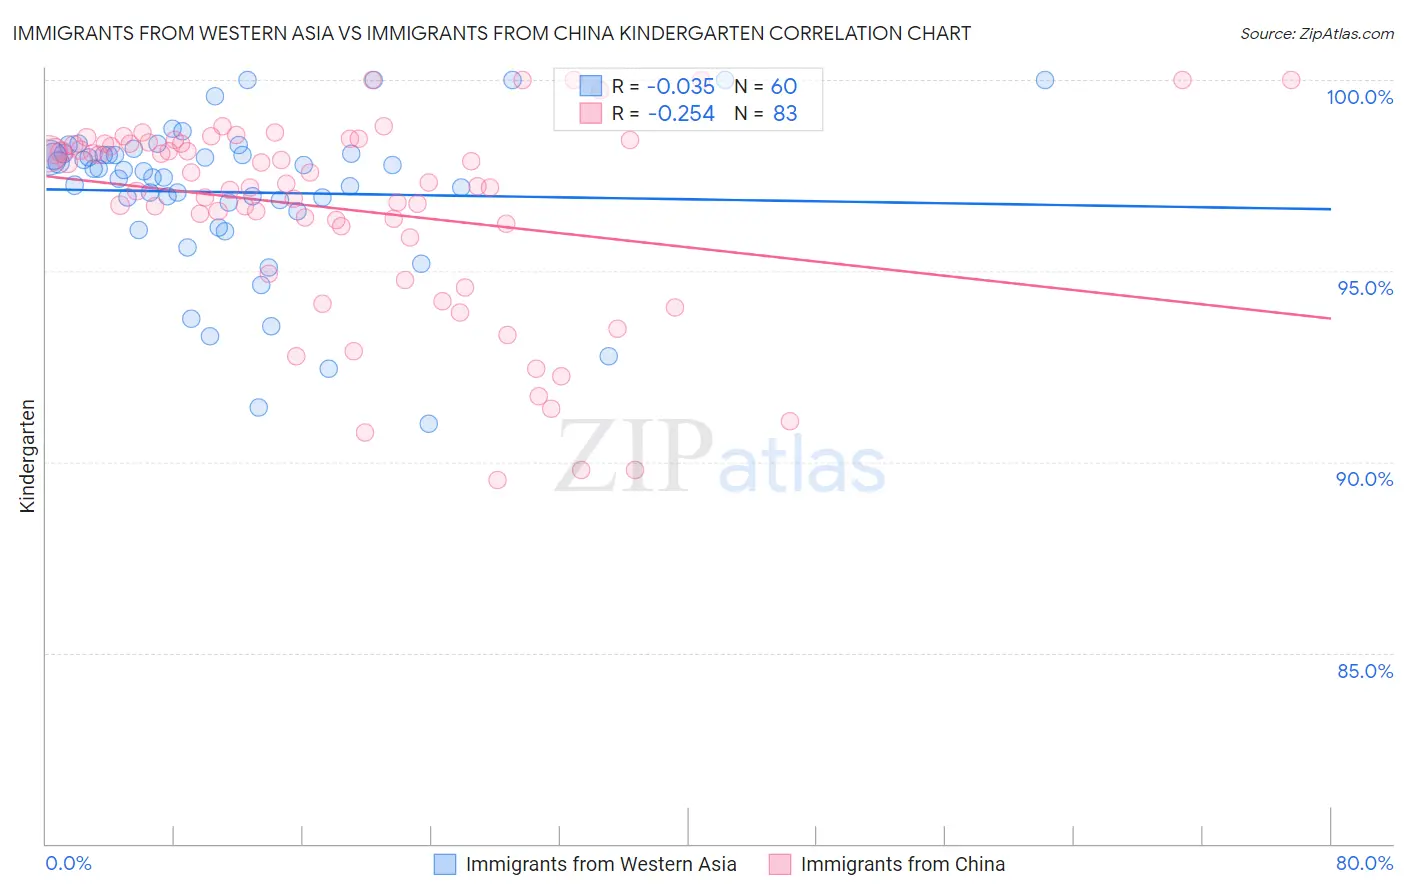
Immigrants from Western Asia vs Immigrants from China Kindergarten Correlation Chart
The statistical analysis conducted on geographies consisting of 404,424,892 people shows no correlation between the proportion of Immigrants from Western Asia and percentage of population with at least kindergarten education in the United States with a correlation coefficient (R) of -0.035 and weighted average of 97.7%. Similarly, the statistical analysis conducted on geographies consisting of 457,082,957 people shows a weak negative correlation between the proportion of Immigrants from China and percentage of population with at least kindergarten education in the United States with a correlation coefficient (R) of -0.254 and weighted average of 97.4%, a difference of 0.22%.
Kindergarten Correlation Summary
| Measurement | Immigrants from Western Asia | Immigrants from China |
| Minimum | 91.0% | 89.5% |
| Maximum | 100.0% | 100.0% |
| Range | 9.0% | 10.5% |
| Mean | 97.1% | 96.6% |
| Median | 97.6% | 97.3% |
| Interquartile 25% (IQ1) | 96.7% | 95.9% |
| Interquartile 75% (IQ3) | 98.1% | 98.3% |
| Interquartile Range (IQR) | 1.4% | 2.5% |
| Standard Deviation (Sample) | 2.0% | 2.6% |
| Standard Deviation (Population) | 2.0% | 2.6% |
Similar Demographics by Kindergarten
Demographics Similar to Immigrants from Western Asia by Kindergarten
In terms of kindergarten, the demographic groups most similar to Immigrants from Western Asia are Immigrants from Pakistan (97.7%, a difference of 0.0%), Immigrants from Malaysia (97.7%, a difference of 0.0%), Colombian (97.7%, a difference of 0.0%), Immigrants from Uruguay (97.7%, a difference of 0.010%), and Nigerian (97.6%, a difference of 0.010%).
| Demographics | Rating | Rank | Kindergarten |
| Sierra Leoneans | 3.4 /100 | #229 | Tragic 97.7% |
| Senegalese | 3.3 /100 | #230 | Tragic 97.7% |
| Puerto Ricans | 2.7 /100 | #231 | Tragic 97.7% |
| Immigrants | Uruguay | 2.6 /100 | #232 | Tragic 97.7% |
| Immigrants | Pakistan | 2.2 /100 | #233 | Tragic 97.7% |
| Immigrants | Malaysia | 2.2 /100 | #234 | Tragic 97.7% |
| Colombians | 2.2 /100 | #235 | Tragic 97.7% |
| Immigrants | Western Asia | 2.1 /100 | #236 | Tragic 97.7% |
| Nigerians | 1.8 /100 | #237 | Tragic 97.6% |
| Immigrants | Eastern Asia | 1.7 /100 | #238 | Tragic 97.6% |
| U.S. Virgin Islanders | 1.7 /100 | #239 | Tragic 97.6% |
| Koreans | 1.6 /100 | #240 | Tragic 97.6% |
| Liberians | 1.3 /100 | #241 | Tragic 97.6% |
| Immigrants | Indonesia | 1.3 /100 | #242 | Tragic 97.6% |
| Asians | 1.2 /100 | #243 | Tragic 97.6% |
Demographics Similar to Immigrants from China by Kindergarten
In terms of kindergarten, the demographic groups most similar to Immigrants from China are Immigrants from Cameroon (97.4%, a difference of 0.0%), Ghanaian (97.4%, a difference of 0.0%), Immigrants from Bolivia (97.5%, a difference of 0.020%), Immigrants from Philippines (97.4%, a difference of 0.020%), and Immigrants from Peru (97.5%, a difference of 0.030%).
| Demographics | Rating | Rank | Kindergarten |
| Immigrants | Sierra Leone | 0.3 /100 | #266 | Tragic 97.5% |
| Immigrants | Liberia | 0.3 /100 | #267 | Tragic 97.5% |
| Immigrants | Nigeria | 0.3 /100 | #268 | Tragic 97.5% |
| West Indians | 0.3 /100 | #269 | Tragic 97.5% |
| Immigrants | Jamaica | 0.2 /100 | #270 | Tragic 97.5% |
| Immigrants | Peru | 0.2 /100 | #271 | Tragic 97.5% |
| Immigrants | Bolivia | 0.2 /100 | #272 | Tragic 97.5% |
| Immigrants | China | 0.1 /100 | #273 | Tragic 97.4% |
| Immigrants | Cameroon | 0.1 /100 | #274 | Tragic 97.4% |
| Ghanaians | 0.1 /100 | #275 | Tragic 97.4% |
| Immigrants | Philippines | 0.1 /100 | #276 | Tragic 97.4% |
| Immigrants | Western Africa | 0.1 /100 | #277 | Tragic 97.4% |
| Immigrants | Uzbekistan | 0.1 /100 | #278 | Tragic 97.4% |
| Immigrants | Ghana | 0.1 /100 | #279 | Tragic 97.4% |
| Barbadians | 0.1 /100 | #280 | Tragic 97.4% |