Immigrants from Sudan vs Immigrants from Cabo Verde Median Earnings
COMPARE
Immigrants from Sudan
Immigrants from Cabo Verde
Median Earnings
Median Earnings Comparison
Immigrants from Sudan
Immigrants from Cabo Verde
$44,767
MEDIAN EARNINGS
8.8/ 100
METRIC RATING
233rd/ 347
METRIC RANK
$43,963
MEDIAN EARNINGS
3.0/ 100
METRIC RATING
247th/ 347
METRIC RANK
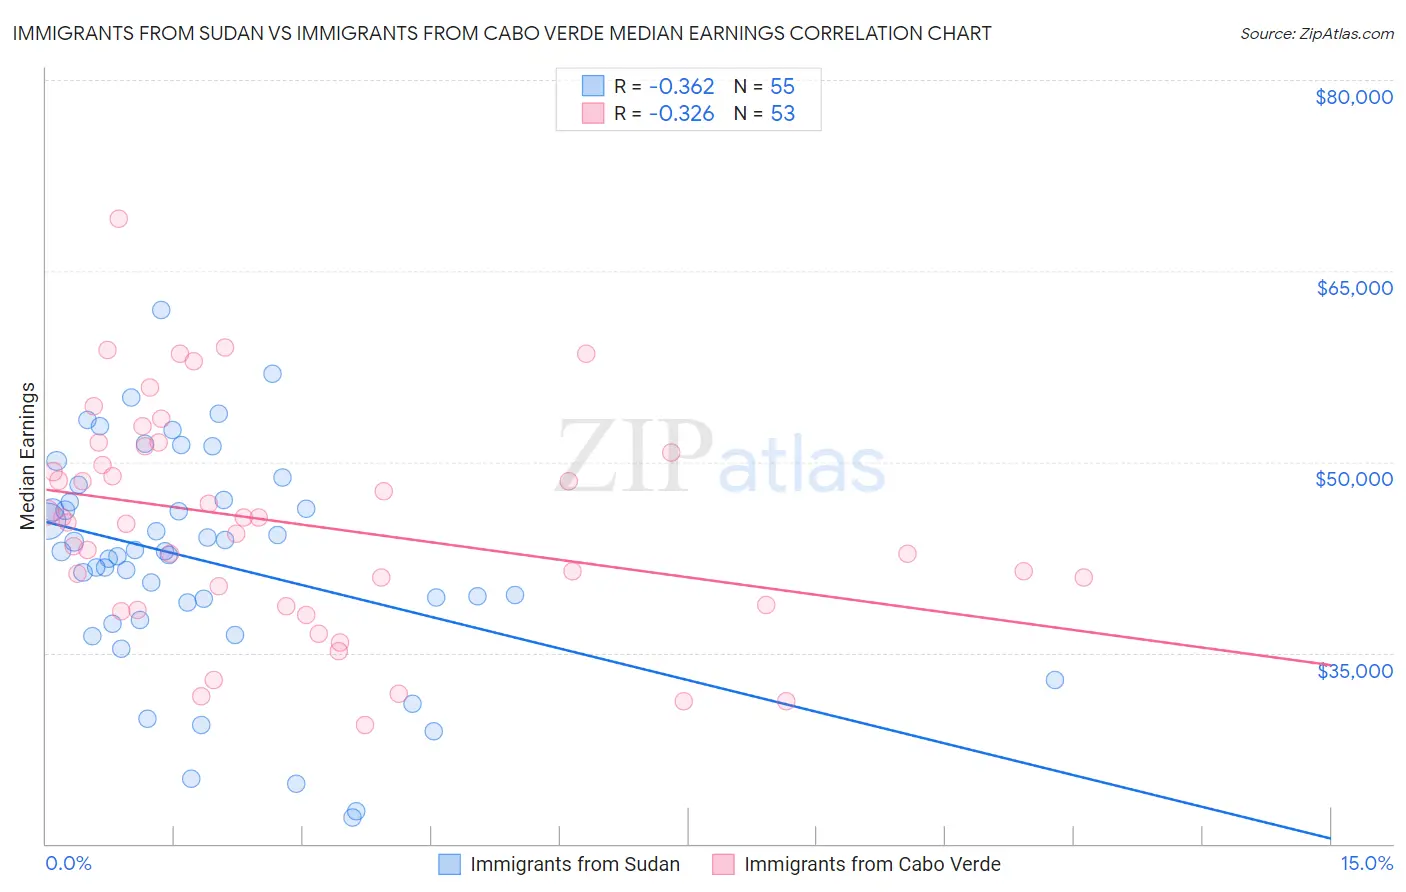
Immigrants from Sudan vs Immigrants from Cabo Verde Median Earnings Correlation Chart
The statistical analysis conducted on geographies consisting of 118,956,438 people shows a mild negative correlation between the proportion of Immigrants from Sudan and median earnings in the United States with a correlation coefficient (R) of -0.362 and weighted average of $44,767. Similarly, the statistical analysis conducted on geographies consisting of 38,158,666 people shows a mild negative correlation between the proportion of Immigrants from Cabo Verde and median earnings in the United States with a correlation coefficient (R) of -0.326 and weighted average of $43,963, a difference of 1.8%.
Median Earnings Correlation Summary
| Measurement | Immigrants from Sudan | Immigrants from Cabo Verde |
| Minimum | $22,094 | $29,297 |
| Maximum | $61,886 | $69,097 |
| Range | $39,792 | $39,800 |
| Mean | $42,201 | $45,169 |
| Median | $42,956 | $45,280 |
| Interquartile 25% (IQ1) | $37,545 | $38,744 |
| Interquartile 75% (IQ3) | $47,029 | $50,961 |
| Interquartile Range (IQR) | $9,484 | $12,217 |
| Standard Deviation (Sample) | $8,696 | $8,556 |
| Standard Deviation (Population) | $8,617 | $8,475 |
Demographics Similar to Immigrants from Sudan and Immigrants from Cabo Verde by Median Earnings
In terms of median earnings, the demographic groups most similar to Immigrants from Sudan are Delaware ($44,783, a difference of 0.040%), Japanese ($44,825, a difference of 0.13%), Immigrants from Western Africa ($44,893, a difference of 0.28%), Cape Verdean ($44,640, a difference of 0.28%), and Venezuelan ($44,580, a difference of 0.42%). Similarly, the demographic groups most similar to Immigrants from Cabo Verde are Immigrants from West Indies ($43,989, a difference of 0.060%), Immigrants from Burma/Myanmar ($43,998, a difference of 0.080%), Nepalese ($43,860, a difference of 0.24%), Malaysian ($43,844, a difference of 0.27%), and Subsaharan African ($44,118, a difference of 0.35%).
| Demographics | Rating | Rank | Median Earnings |
| Immigrants | Western Africa | 10.3 /100 | #230 | Poor $44,893 |
| Japanese | 9.5 /100 | #231 | Tragic $44,825 |
| Delaware | 9.0 /100 | #232 | Tragic $44,783 |
| Immigrants | Sudan | 8.8 /100 | #233 | Tragic $44,767 |
| Cape Verdeans | 7.5 /100 | #234 | Tragic $44,640 |
| Venezuelans | 6.9 /100 | #235 | Tragic $44,580 |
| British West Indians | 6.7 /100 | #236 | Tragic $44,552 |
| Immigrants | Ecuador | 5.9 /100 | #237 | Tragic $44,462 |
| Sudanese | 5.6 /100 | #238 | Tragic $44,419 |
| Senegalese | 5.3 /100 | #239 | Tragic $44,373 |
| Aleuts | 4.4 /100 | #240 | Tragic $44,241 |
| Samoans | 4.2 /100 | #241 | Tragic $44,206 |
| Immigrants | Venezuela | 4.0 /100 | #242 | Tragic $44,163 |
| Sub-Saharan Africans | 3.7 /100 | #243 | Tragic $44,118 |
| Immigrants | Nonimmigrants | 3.7 /100 | #244 | Tragic $44,117 |
| Immigrants | Burma/Myanmar | 3.2 /100 | #245 | Tragic $43,998 |
| Immigrants | West Indies | 3.1 /100 | #246 | Tragic $43,989 |
| Immigrants | Cabo Verde | 3.0 /100 | #247 | Tragic $43,963 |
| Nepalese | 2.6 /100 | #248 | Tragic $43,860 |
| Malaysians | 2.6 /100 | #249 | Tragic $43,844 |
| Alaska Natives | 2.3 /100 | #250 | Tragic $43,750 |