Immigrants from Sudan vs Bermudan Median Earnings
COMPARE
Immigrants from Sudan
Bermudan
Median Earnings
Median Earnings Comparison
Immigrants from Sudan
Bermudans
$44,767
MEDIAN EARNINGS
8.8/ 100
METRIC RATING
233rd/ 347
METRIC RANK
$45,593
MEDIAN EARNINGS
23.5/ 100
METRIC RATING
212th/ 347
METRIC RANK
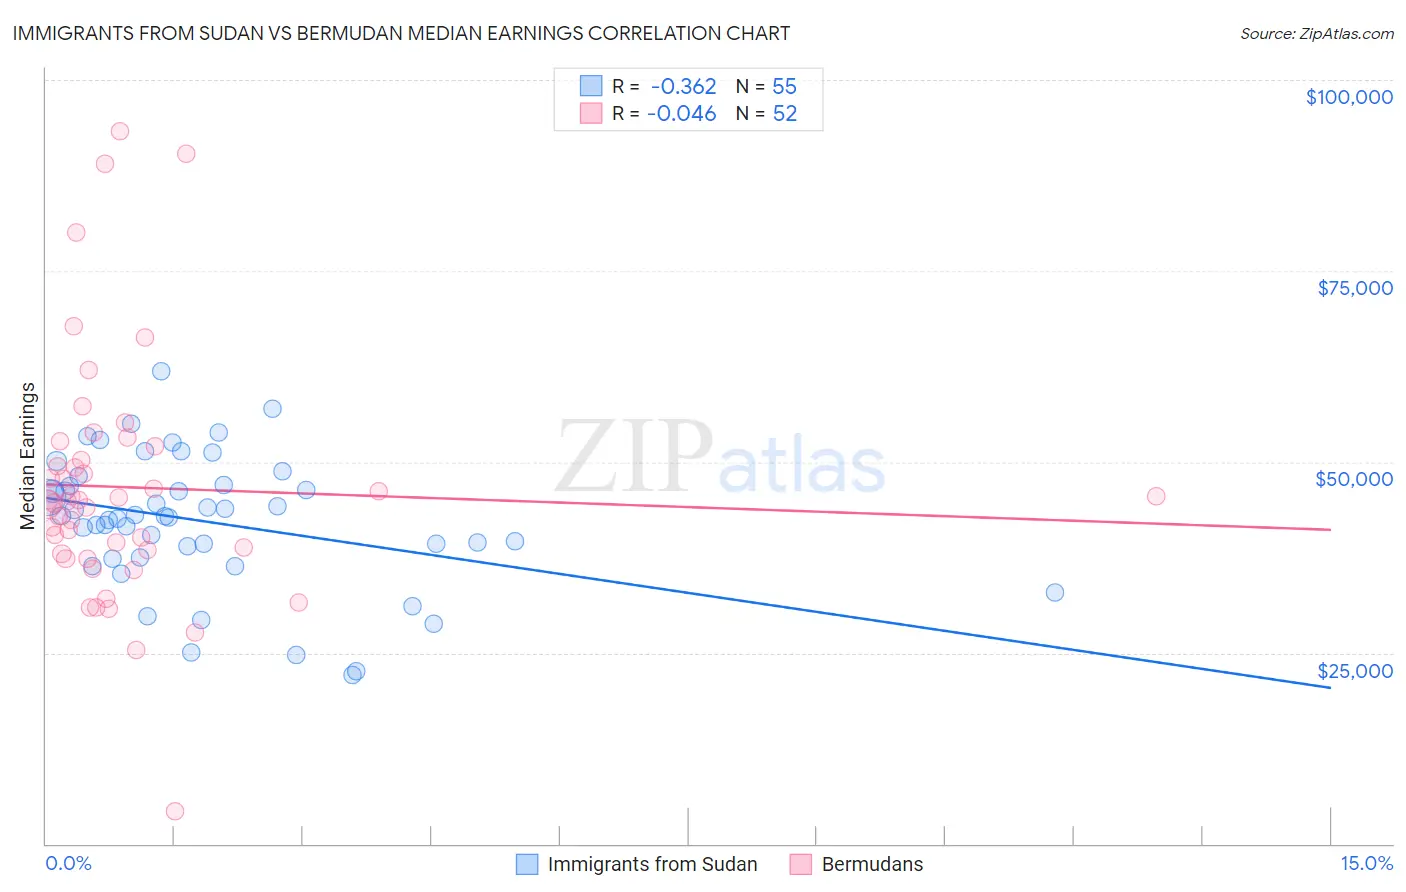
Immigrants from Sudan vs Bermudan Median Earnings Correlation Chart
The statistical analysis conducted on geographies consisting of 118,956,438 people shows a mild negative correlation between the proportion of Immigrants from Sudan and median earnings in the United States with a correlation coefficient (R) of -0.362 and weighted average of $44,767. Similarly, the statistical analysis conducted on geographies consisting of 55,730,379 people shows no correlation between the proportion of Bermudans and median earnings in the United States with a correlation coefficient (R) of -0.046 and weighted average of $45,593, a difference of 1.8%.
Median Earnings Correlation Summary
| Measurement | Immigrants from Sudan | Bermudan |
| Minimum | $22,094 | $4,250 |
| Maximum | $61,886 | $93,350 |
| Range | $39,792 | $89,100 |
| Mean | $42,201 | $46,670 |
| Median | $42,956 | $44,943 |
| Interquartile 25% (IQ1) | $37,545 | $38,258 |
| Interquartile 75% (IQ3) | $47,029 | $51,130 |
| Interquartile Range (IQR) | $9,484 | $12,872 |
| Standard Deviation (Sample) | $8,696 | $16,028 |
| Standard Deviation (Population) | $8,617 | $15,873 |
Similar Demographics by Median Earnings
Demographics Similar to Immigrants from Sudan by Median Earnings
In terms of median earnings, the demographic groups most similar to Immigrants from Sudan are Delaware ($44,783, a difference of 0.040%), Japanese ($44,825, a difference of 0.13%), Immigrants from Western Africa ($44,893, a difference of 0.28%), Cape Verdean ($44,640, a difference of 0.28%), and Scotch-Irish ($44,924, a difference of 0.35%).
| Demographics | Rating | Rank | Median Earnings |
| Immigrants | Nigeria | 12.2 /100 | #226 | Poor $45,030 |
| Native Hawaiians | 12.2 /100 | #227 | Poor $45,027 |
| Immigrants | Iraq | 11.6 /100 | #228 | Poor $44,988 |
| Scotch-Irish | 10.7 /100 | #229 | Poor $44,924 |
| Immigrants | Western Africa | 10.3 /100 | #230 | Poor $44,893 |
| Japanese | 9.5 /100 | #231 | Tragic $44,825 |
| Delaware | 9.0 /100 | #232 | Tragic $44,783 |
| Immigrants | Sudan | 8.8 /100 | #233 | Tragic $44,767 |
| Cape Verdeans | 7.5 /100 | #234 | Tragic $44,640 |
| Venezuelans | 6.9 /100 | #235 | Tragic $44,580 |
| British West Indians | 6.7 /100 | #236 | Tragic $44,552 |
| Immigrants | Ecuador | 5.9 /100 | #237 | Tragic $44,462 |
| Sudanese | 5.6 /100 | #238 | Tragic $44,419 |
| Senegalese | 5.3 /100 | #239 | Tragic $44,373 |
| Aleuts | 4.4 /100 | #240 | Tragic $44,241 |
Demographics Similar to Bermudans by Median Earnings
In terms of median earnings, the demographic groups most similar to Bermudans are Panamanian ($45,593, a difference of 0.0%), Immigrants from Bosnia and Herzegovina ($45,600, a difference of 0.010%), Immigrants from Thailand ($45,598, a difference of 0.010%), Immigrants from Grenada ($45,596, a difference of 0.010%), and Immigrants from Senegal ($45,611, a difference of 0.040%).
| Demographics | Rating | Rank | Median Earnings |
| Tongans | 25.4 /100 | #205 | Fair $45,665 |
| Immigrants | Ghana | 24.8 /100 | #206 | Fair $45,641 |
| Immigrants | Senegal | 24.0 /100 | #207 | Fair $45,611 |
| Immigrants | Bosnia and Herzegovina | 23.7 /100 | #208 | Fair $45,600 |
| Immigrants | Thailand | 23.7 /100 | #209 | Fair $45,598 |
| Immigrants | Grenada | 23.6 /100 | #210 | Fair $45,596 |
| Panamanians | 23.5 /100 | #211 | Fair $45,593 |
| Bermudans | 23.5 /100 | #212 | Fair $45,593 |
| Immigrants | Colombia | 22.4 /100 | #213 | Fair $45,550 |
| Nigerians | 22.0 /100 | #214 | Fair $45,532 |
| Immigrants | Bangladesh | 22.0 /100 | #215 | Fair $45,532 |
| Guyanese | 20.6 /100 | #216 | Fair $45,470 |
| Tlingit-Haida | 20.5 /100 | #217 | Fair $45,468 |
| Spanish | 19.7 /100 | #218 | Poor $45,432 |
| Dutch | 18.4 /100 | #219 | Poor $45,370 |