Immigrants from Sudan vs Immigrants from Belgium Median Earnings
COMPARE
Immigrants from Sudan
Immigrants from Belgium
Median Earnings
Median Earnings Comparison
Immigrants from Sudan
Immigrants from Belgium
$44,767
MEDIAN EARNINGS
8.8/ 100
METRIC RATING
233rd/ 347
METRIC RANK
$54,679
MEDIAN EARNINGS
100.0/ 100
METRIC RATING
19th/ 347
METRIC RANK
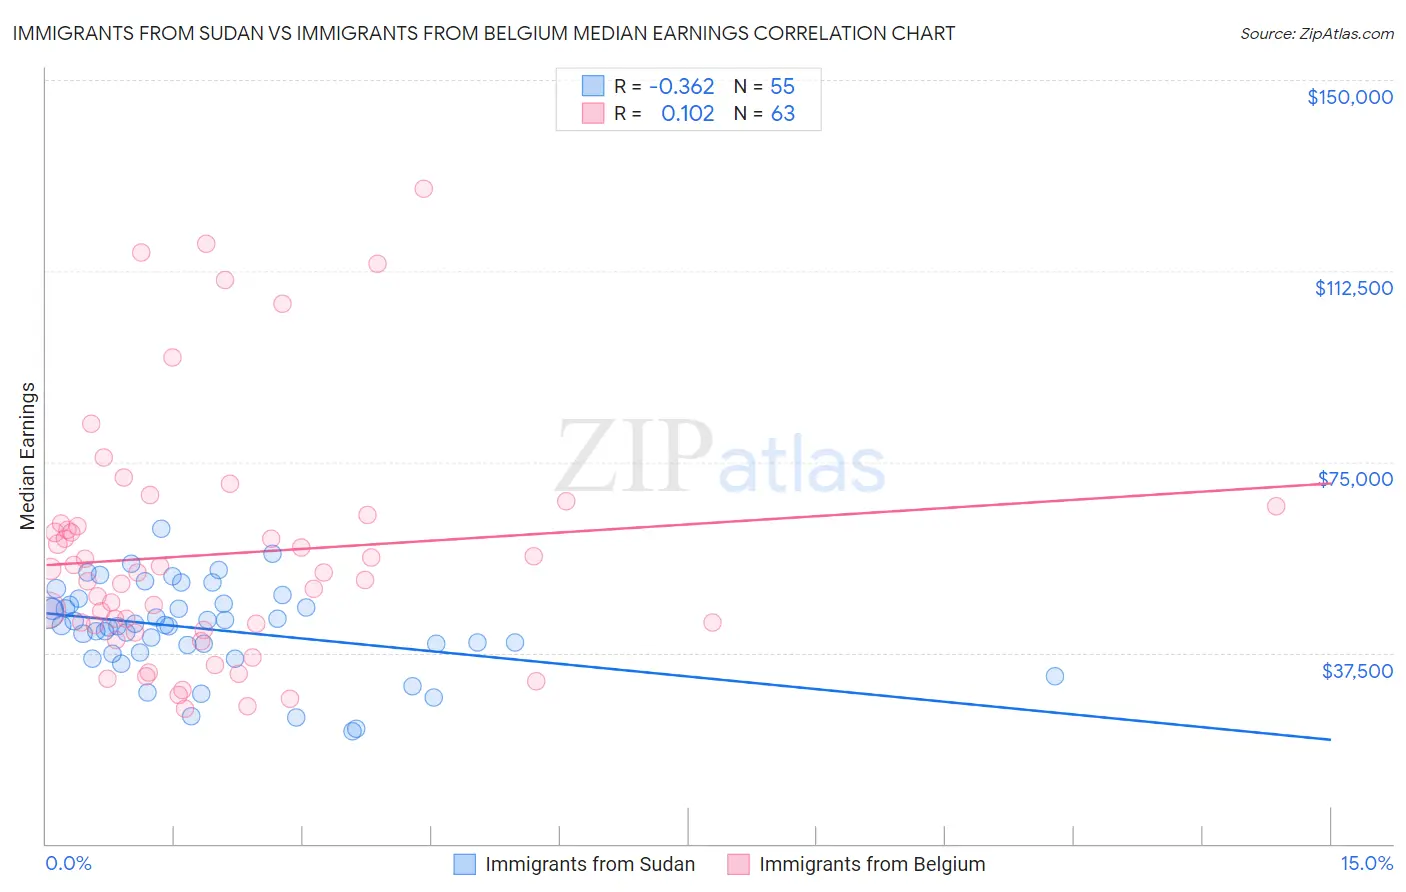
Immigrants from Sudan vs Immigrants from Belgium Median Earnings Correlation Chart
The statistical analysis conducted on geographies consisting of 118,956,438 people shows a mild negative correlation between the proportion of Immigrants from Sudan and median earnings in the United States with a correlation coefficient (R) of -0.362 and weighted average of $44,767. Similarly, the statistical analysis conducted on geographies consisting of 146,713,420 people shows a poor positive correlation between the proportion of Immigrants from Belgium and median earnings in the United States with a correlation coefficient (R) of 0.102 and weighted average of $54,679, a difference of 22.1%.
Median Earnings Correlation Summary
| Measurement | Immigrants from Sudan | Immigrants from Belgium |
| Minimum | $22,094 | $26,625 |
| Maximum | $61,886 | $128,750 |
| Range | $39,792 | $102,125 |
| Mean | $42,201 | $56,854 |
| Median | $42,956 | $53,265 |
| Interquartile 25% (IQ1) | $37,545 | $41,924 |
| Interquartile 75% (IQ3) | $47,029 | $62,836 |
| Interquartile Range (IQR) | $9,484 | $20,912 |
| Standard Deviation (Sample) | $8,696 | $23,786 |
| Standard Deviation (Population) | $8,617 | $23,597 |
Similar Demographics by Median Earnings
Demographics Similar to Immigrants from Sudan by Median Earnings
In terms of median earnings, the demographic groups most similar to Immigrants from Sudan are Delaware ($44,783, a difference of 0.040%), Japanese ($44,825, a difference of 0.13%), Immigrants from Western Africa ($44,893, a difference of 0.28%), Cape Verdean ($44,640, a difference of 0.28%), and Scotch-Irish ($44,924, a difference of 0.35%).
| Demographics | Rating | Rank | Median Earnings |
| Immigrants | Nigeria | 12.2 /100 | #226 | Poor $45,030 |
| Native Hawaiians | 12.2 /100 | #227 | Poor $45,027 |
| Immigrants | Iraq | 11.6 /100 | #228 | Poor $44,988 |
| Scotch-Irish | 10.7 /100 | #229 | Poor $44,924 |
| Immigrants | Western Africa | 10.3 /100 | #230 | Poor $44,893 |
| Japanese | 9.5 /100 | #231 | Tragic $44,825 |
| Delaware | 9.0 /100 | #232 | Tragic $44,783 |
| Immigrants | Sudan | 8.8 /100 | #233 | Tragic $44,767 |
| Cape Verdeans | 7.5 /100 | #234 | Tragic $44,640 |
| Venezuelans | 6.9 /100 | #235 | Tragic $44,580 |
| British West Indians | 6.7 /100 | #236 | Tragic $44,552 |
| Immigrants | Ecuador | 5.9 /100 | #237 | Tragic $44,462 |
| Sudanese | 5.6 /100 | #238 | Tragic $44,419 |
| Senegalese | 5.3 /100 | #239 | Tragic $44,373 |
| Aleuts | 4.4 /100 | #240 | Tragic $44,241 |
Demographics Similar to Immigrants from Belgium by Median Earnings
In terms of median earnings, the demographic groups most similar to Immigrants from Belgium are Cypriot ($54,589, a difference of 0.16%), Burmese ($54,559, a difference of 0.22%), Immigrants from Korea ($54,530, a difference of 0.27%), Immigrants from Sweden ($54,478, a difference of 0.37%), and Immigrants from Japan ($54,938, a difference of 0.47%).
| Demographics | Rating | Rank | Median Earnings |
| Immigrants | Ireland | 100.0 /100 | #12 | Exceptional $56,854 |
| Immigrants | China | 100.0 /100 | #13 | Exceptional $56,638 |
| Immigrants | Australia | 100.0 /100 | #14 | Exceptional $56,305 |
| Indians (Asian) | 100.0 /100 | #15 | Exceptional $56,253 |
| Immigrants | Eastern Asia | 100.0 /100 | #16 | Exceptional $56,183 |
| Eastern Europeans | 100.0 /100 | #17 | Exceptional $55,084 |
| Immigrants | Japan | 100.0 /100 | #18 | Exceptional $54,938 |
| Immigrants | Belgium | 100.0 /100 | #19 | Exceptional $54,679 |
| Cypriots | 100.0 /100 | #20 | Exceptional $54,589 |
| Burmese | 100.0 /100 | #21 | Exceptional $54,559 |
| Immigrants | Korea | 100.0 /100 | #22 | Exceptional $54,530 |
| Immigrants | Sweden | 100.0 /100 | #23 | Exceptional $54,478 |
| Soviet Union | 100.0 /100 | #24 | Exceptional $54,290 |
| Turks | 100.0 /100 | #25 | Exceptional $53,919 |
| Immigrants | Northern Europe | 100.0 /100 | #26 | Exceptional $53,872 |