Cheyenne vs Immigrants from Cabo Verde Median Earnings
COMPARE
Cheyenne
Immigrants from Cabo Verde
Median Earnings
Median Earnings Comparison
Cheyenne
Immigrants from Cabo Verde
$40,233
MEDIAN EARNINGS
0.0/ 100
METRIC RATING
314th/ 347
METRIC RANK
$43,963
MEDIAN EARNINGS
3.0/ 100
METRIC RATING
247th/ 347
METRIC RANK
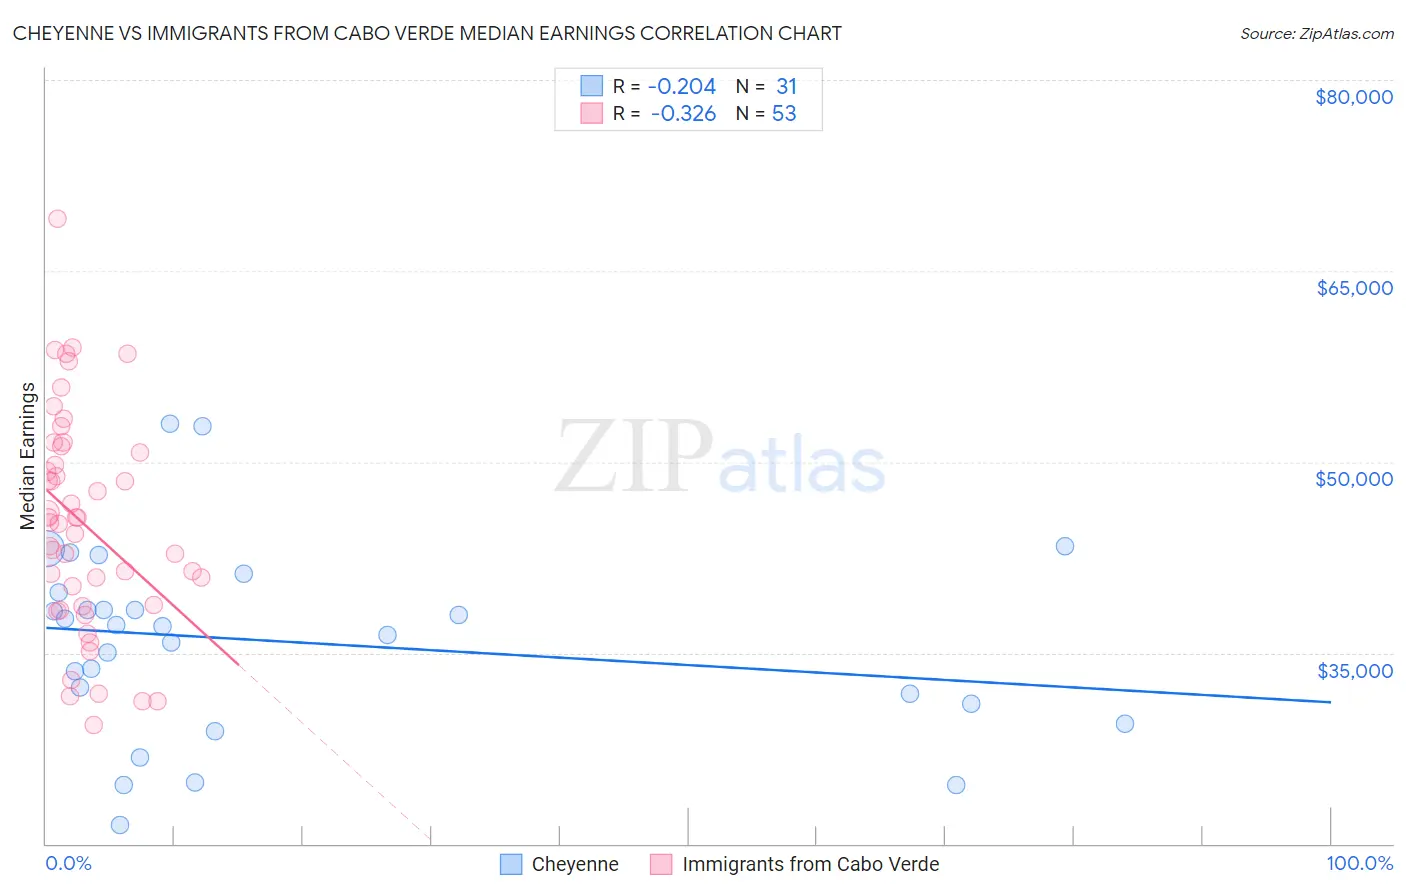
Cheyenne vs Immigrants from Cabo Verde Median Earnings Correlation Chart
The statistical analysis conducted on geographies consisting of 80,717,230 people shows a weak negative correlation between the proportion of Cheyenne and median earnings in the United States with a correlation coefficient (R) of -0.204 and weighted average of $40,233. Similarly, the statistical analysis conducted on geographies consisting of 38,158,666 people shows a mild negative correlation between the proportion of Immigrants from Cabo Verde and median earnings in the United States with a correlation coefficient (R) of -0.326 and weighted average of $43,963, a difference of 9.3%.
Median Earnings Correlation Summary
| Measurement | Cheyenne | Immigrants from Cabo Verde |
| Minimum | $21,433 | $29,297 |
| Maximum | $52,964 | $69,097 |
| Range | $31,531 | $39,800 |
| Mean | $35,877 | $45,169 |
| Median | $37,115 | $45,280 |
| Interquartile 25% (IQ1) | $31,011 | $38,744 |
| Interquartile 75% (IQ3) | $39,717 | $50,961 |
| Interquartile Range (IQR) | $8,706 | $12,217 |
| Standard Deviation (Sample) | $7,496 | $8,556 |
| Standard Deviation (Population) | $7,374 | $8,475 |
Similar Demographics by Median Earnings
Demographics Similar to Cheyenne by Median Earnings
In terms of median earnings, the demographic groups most similar to Cheyenne are Seminole ($40,233, a difference of 0.0%), Choctaw ($40,270, a difference of 0.090%), Immigrants from Honduras ($40,195, a difference of 0.10%), Fijian ($40,193, a difference of 0.10%), and Chippewa ($40,287, a difference of 0.13%).
| Demographics | Rating | Rank | Median Earnings |
| Hondurans | 0.0 /100 | #307 | Tragic $40,638 |
| Cubans | 0.0 /100 | #308 | Tragic $40,619 |
| Immigrants | Haiti | 0.0 /100 | #309 | Tragic $40,550 |
| Apache | 0.0 /100 | #310 | Tragic $40,388 |
| Hispanics or Latinos | 0.0 /100 | #311 | Tragic $40,288 |
| Chippewa | 0.0 /100 | #312 | Tragic $40,287 |
| Choctaw | 0.0 /100 | #313 | Tragic $40,270 |
| Cheyenne | 0.0 /100 | #314 | Tragic $40,233 |
| Seminole | 0.0 /100 | #315 | Tragic $40,233 |
| Immigrants | Honduras | 0.0 /100 | #316 | Tragic $40,195 |
| Fijians | 0.0 /100 | #317 | Tragic $40,193 |
| Dutch West Indians | 0.0 /100 | #318 | Tragic $40,107 |
| Blacks/African Americans | 0.0 /100 | #319 | Tragic $40,085 |
| Immigrants | Bahamas | 0.0 /100 | #320 | Tragic $39,861 |
| Mexicans | 0.0 /100 | #321 | Tragic $39,834 |
Demographics Similar to Immigrants from Cabo Verde by Median Earnings
In terms of median earnings, the demographic groups most similar to Immigrants from Cabo Verde are Immigrants from West Indies ($43,989, a difference of 0.060%), Immigrants from Burma/Myanmar ($43,998, a difference of 0.080%), Nepalese ($43,860, a difference of 0.24%), Malaysian ($43,844, a difference of 0.27%), and Subsaharan African ($44,118, a difference of 0.35%).
| Demographics | Rating | Rank | Median Earnings |
| Aleuts | 4.4 /100 | #240 | Tragic $44,241 |
| Samoans | 4.2 /100 | #241 | Tragic $44,206 |
| Immigrants | Venezuela | 4.0 /100 | #242 | Tragic $44,163 |
| Sub-Saharan Africans | 3.7 /100 | #243 | Tragic $44,118 |
| Immigrants | Nonimmigrants | 3.7 /100 | #244 | Tragic $44,117 |
| Immigrants | Burma/Myanmar | 3.2 /100 | #245 | Tragic $43,998 |
| Immigrants | West Indies | 3.1 /100 | #246 | Tragic $43,989 |
| Immigrants | Cabo Verde | 3.0 /100 | #247 | Tragic $43,963 |
| Nepalese | 2.6 /100 | #248 | Tragic $43,860 |
| Malaysians | 2.6 /100 | #249 | Tragic $43,844 |
| Alaska Natives | 2.3 /100 | #250 | Tragic $43,750 |
| Tsimshian | 2.1 /100 | #251 | Tragic $43,695 |
| Hawaiians | 2.0 /100 | #252 | Tragic $43,673 |
| Somalis | 1.8 /100 | #253 | Tragic $43,567 |
| Liberians | 1.7 /100 | #254 | Tragic $43,536 |