Immigrants from Sudan vs Immigrants from France Median Earnings
COMPARE
Immigrants from Sudan
Immigrants from France
Median Earnings
Median Earnings Comparison
Immigrants from Sudan
Immigrants from France
$44,767
MEDIAN EARNINGS
8.8/ 100
METRIC RATING
233rd/ 347
METRIC RANK
$53,490
MEDIAN EARNINGS
100.0/ 100
METRIC RATING
28th/ 347
METRIC RANK
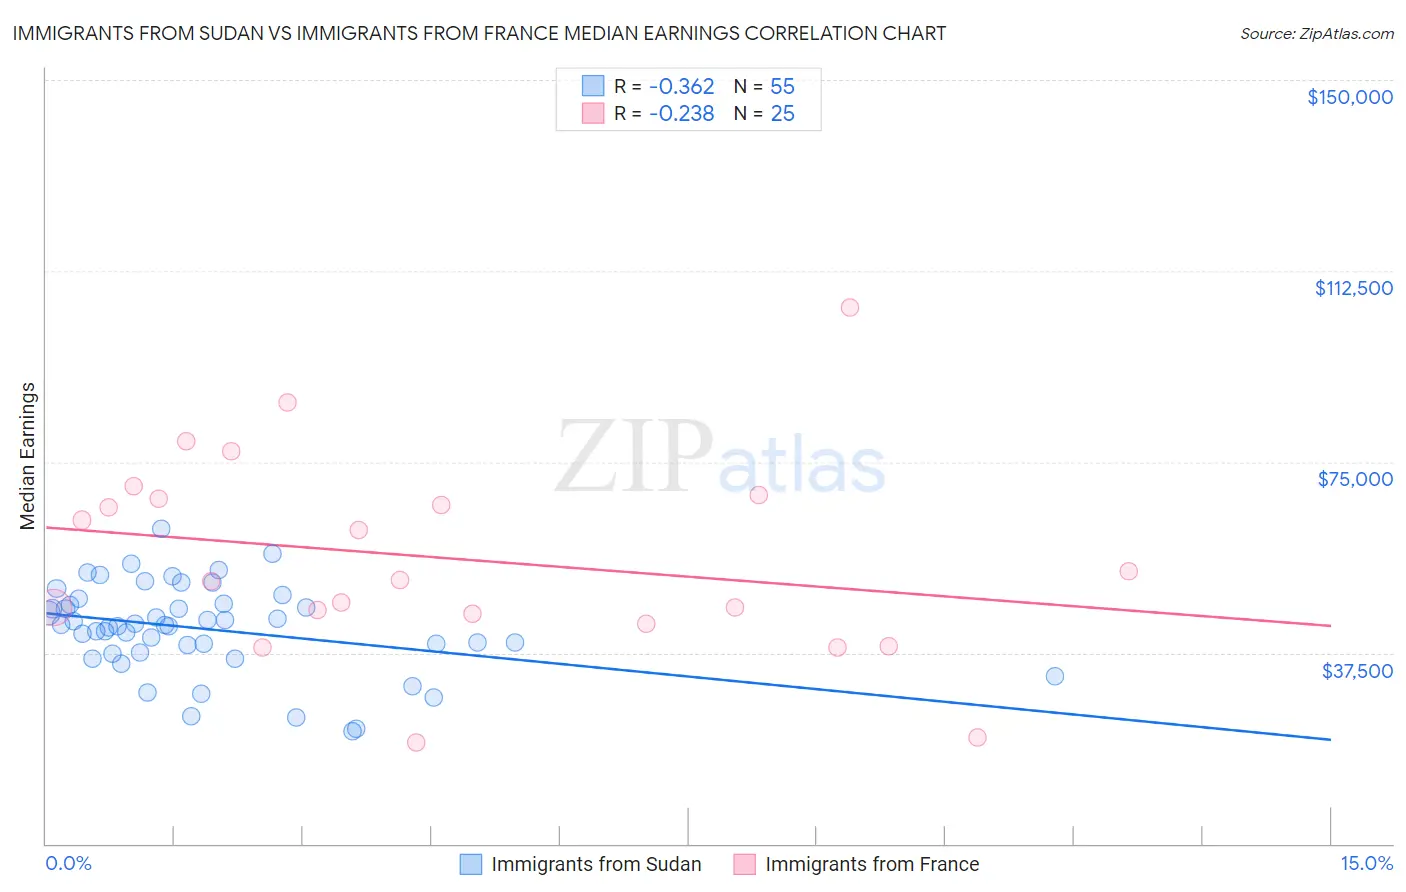
Immigrants from Sudan vs Immigrants from France Median Earnings Correlation Chart
The statistical analysis conducted on geographies consisting of 118,956,438 people shows a mild negative correlation between the proportion of Immigrants from Sudan and median earnings in the United States with a correlation coefficient (R) of -0.362 and weighted average of $44,767. Similarly, the statistical analysis conducted on geographies consisting of 287,897,093 people shows a weak negative correlation between the proportion of Immigrants from France and median earnings in the United States with a correlation coefficient (R) of -0.238 and weighted average of $53,490, a difference of 19.5%.
Median Earnings Correlation Summary
| Measurement | Immigrants from Sudan | Immigrants from France |
| Minimum | $22,094 | $19,781 |
| Maximum | $61,886 | $105,221 |
| Range | $39,792 | $85,440 |
| Mean | $42,201 | $56,012 |
| Median | $42,956 | $51,881 |
| Interquartile 25% (IQ1) | $37,545 | $44,190 |
| Interquartile 75% (IQ3) | $47,029 | $68,204 |
| Interquartile Range (IQR) | $9,484 | $24,013 |
| Standard Deviation (Sample) | $8,696 | $19,673 |
| Standard Deviation (Population) | $8,617 | $19,276 |
Similar Demographics by Median Earnings
Demographics Similar to Immigrants from Sudan by Median Earnings
In terms of median earnings, the demographic groups most similar to Immigrants from Sudan are Delaware ($44,783, a difference of 0.040%), Japanese ($44,825, a difference of 0.13%), Immigrants from Western Africa ($44,893, a difference of 0.28%), Cape Verdean ($44,640, a difference of 0.28%), and Scotch-Irish ($44,924, a difference of 0.35%).
| Demographics | Rating | Rank | Median Earnings |
| Immigrants | Nigeria | 12.2 /100 | #226 | Poor $45,030 |
| Native Hawaiians | 12.2 /100 | #227 | Poor $45,027 |
| Immigrants | Iraq | 11.6 /100 | #228 | Poor $44,988 |
| Scotch-Irish | 10.7 /100 | #229 | Poor $44,924 |
| Immigrants | Western Africa | 10.3 /100 | #230 | Poor $44,893 |
| Japanese | 9.5 /100 | #231 | Tragic $44,825 |
| Delaware | 9.0 /100 | #232 | Tragic $44,783 |
| Immigrants | Sudan | 8.8 /100 | #233 | Tragic $44,767 |
| Cape Verdeans | 7.5 /100 | #234 | Tragic $44,640 |
| Venezuelans | 6.9 /100 | #235 | Tragic $44,580 |
| British West Indians | 6.7 /100 | #236 | Tragic $44,552 |
| Immigrants | Ecuador | 5.9 /100 | #237 | Tragic $44,462 |
| Sudanese | 5.6 /100 | #238 | Tragic $44,419 |
| Senegalese | 5.3 /100 | #239 | Tragic $44,373 |
| Aleuts | 4.4 /100 | #240 | Tragic $44,241 |
Demographics Similar to Immigrants from France by Median Earnings
In terms of median earnings, the demographic groups most similar to Immigrants from France are Immigrants from Russia ($53,457, a difference of 0.060%), Cambodian ($53,386, a difference of 0.20%), Russian ($53,334, a difference of 0.29%), Immigrants from Asia ($53,310, a difference of 0.34%), and Asian ($53,690, a difference of 0.37%).
| Demographics | Rating | Rank | Median Earnings |
| Burmese | 100.0 /100 | #21 | Exceptional $54,559 |
| Immigrants | Korea | 100.0 /100 | #22 | Exceptional $54,530 |
| Immigrants | Sweden | 100.0 /100 | #23 | Exceptional $54,478 |
| Soviet Union | 100.0 /100 | #24 | Exceptional $54,290 |
| Turks | 100.0 /100 | #25 | Exceptional $53,919 |
| Immigrants | Northern Europe | 100.0 /100 | #26 | Exceptional $53,872 |
| Asians | 100.0 /100 | #27 | Exceptional $53,690 |
| Immigrants | France | 100.0 /100 | #28 | Exceptional $53,490 |
| Immigrants | Russia | 100.0 /100 | #29 | Exceptional $53,457 |
| Cambodians | 100.0 /100 | #30 | Exceptional $53,386 |
| Russians | 100.0 /100 | #31 | Exceptional $53,334 |
| Immigrants | Asia | 100.0 /100 | #32 | Exceptional $53,310 |
| Immigrants | Greece | 100.0 /100 | #33 | Exceptional $53,282 |
| Immigrants | Sri Lanka | 100.0 /100 | #34 | Exceptional $53,268 |
| Immigrants | Switzerland | 100.0 /100 | #35 | Exceptional $53,211 |