Immigrants from Sudan vs Nigerian Median Earnings
COMPARE
Immigrants from Sudan
Nigerian
Median Earnings
Median Earnings Comparison
Immigrants from Sudan
Nigerians
$44,767
MEDIAN EARNINGS
8.8/ 100
METRIC RATING
233rd/ 347
METRIC RANK
$45,532
MEDIAN EARNINGS
22.0/ 100
METRIC RATING
214th/ 347
METRIC RANK
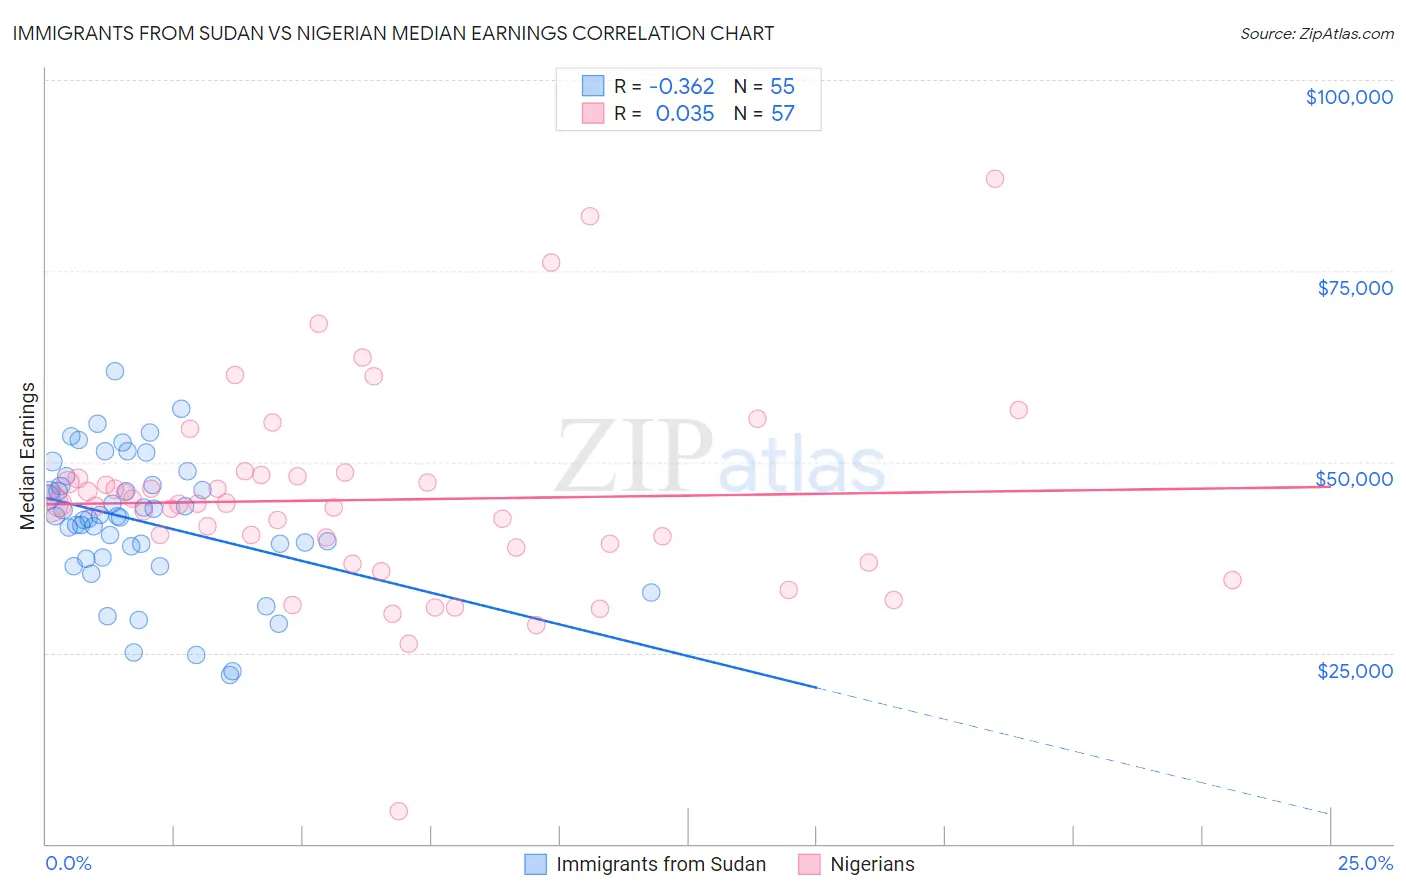
Immigrants from Sudan vs Nigerian Median Earnings Correlation Chart
The statistical analysis conducted on geographies consisting of 118,956,438 people shows a mild negative correlation between the proportion of Immigrants from Sudan and median earnings in the United States with a correlation coefficient (R) of -0.362 and weighted average of $44,767. Similarly, the statistical analysis conducted on geographies consisting of 332,779,942 people shows no correlation between the proportion of Nigerians and median earnings in the United States with a correlation coefficient (R) of 0.035 and weighted average of $45,532, a difference of 1.7%.
Median Earnings Correlation Summary
| Measurement | Immigrants from Sudan | Nigerian |
| Minimum | $22,094 | $4,253 |
| Maximum | $61,886 | $87,061 |
| Range | $39,792 | $82,808 |
| Mean | $42,201 | $45,043 |
| Median | $42,956 | $44,458 |
| Interquartile 25% (IQ1) | $37,545 | $37,816 |
| Interquartile 75% (IQ3) | $47,029 | $48,156 |
| Interquartile Range (IQR) | $9,484 | $10,339 |
| Standard Deviation (Sample) | $8,696 | $13,482 |
| Standard Deviation (Population) | $8,617 | $13,364 |
Demographics Similar to Immigrants from Sudan and Nigerians by Median Earnings
In terms of median earnings, the demographic groups most similar to Immigrants from Sudan are Delaware ($44,783, a difference of 0.040%), Japanese ($44,825, a difference of 0.13%), Immigrants from Western Africa ($44,893, a difference of 0.28%), Scotch-Irish ($44,924, a difference of 0.35%), and Immigrants from Iraq ($44,988, a difference of 0.49%). Similarly, the demographic groups most similar to Nigerians are Immigrants from Bangladesh ($45,532, a difference of 0.0%), Immigrants from Colombia ($45,550, a difference of 0.040%), Guyanese ($45,470, a difference of 0.14%), Tlingit-Haida ($45,468, a difference of 0.14%), and Spanish ($45,432, a difference of 0.22%).
| Demographics | Rating | Rank | Median Earnings |
| Immigrants | Colombia | 22.4 /100 | #213 | Fair $45,550 |
| Nigerians | 22.0 /100 | #214 | Fair $45,532 |
| Immigrants | Bangladesh | 22.0 /100 | #215 | Fair $45,532 |
| Guyanese | 20.6 /100 | #216 | Fair $45,470 |
| Tlingit-Haida | 20.5 /100 | #217 | Fair $45,468 |
| Spanish | 19.7 /100 | #218 | Poor $45,432 |
| Dutch | 18.4 /100 | #219 | Poor $45,370 |
| Ecuadorians | 15.3 /100 | #220 | Poor $45,214 |
| Immigrants | Guyana | 15.1 /100 | #221 | Poor $45,204 |
| Immigrants | Panama | 15.0 /100 | #222 | Poor $45,198 |
| Whites/Caucasians | 15.0 /100 | #223 | Poor $45,197 |
| West Indians | 13.9 /100 | #224 | Poor $45,132 |
| Immigrants | Cambodia | 13.2 /100 | #225 | Poor $45,090 |
| Immigrants | Nigeria | 12.2 /100 | #226 | Poor $45,030 |
| Native Hawaiians | 12.2 /100 | #227 | Poor $45,027 |
| Immigrants | Iraq | 11.6 /100 | #228 | Poor $44,988 |
| Scotch-Irish | 10.7 /100 | #229 | Poor $44,924 |
| Immigrants | Western Africa | 10.3 /100 | #230 | Poor $44,893 |
| Japanese | 9.5 /100 | #231 | Tragic $44,825 |
| Delaware | 9.0 /100 | #232 | Tragic $44,783 |
| Immigrants | Sudan | 8.8 /100 | #233 | Tragic $44,767 |