Ottawa vs Immigrants from Cabo Verde Median Earnings
COMPARE
Ottawa
Immigrants from Cabo Verde
Median Earnings
Median Earnings Comparison
Ottawa
Immigrants from Cabo Verde
$39,721
MEDIAN EARNINGS
0.0/ 100
METRIC RATING
324th/ 347
METRIC RANK
$43,963
MEDIAN EARNINGS
3.0/ 100
METRIC RATING
247th/ 347
METRIC RANK
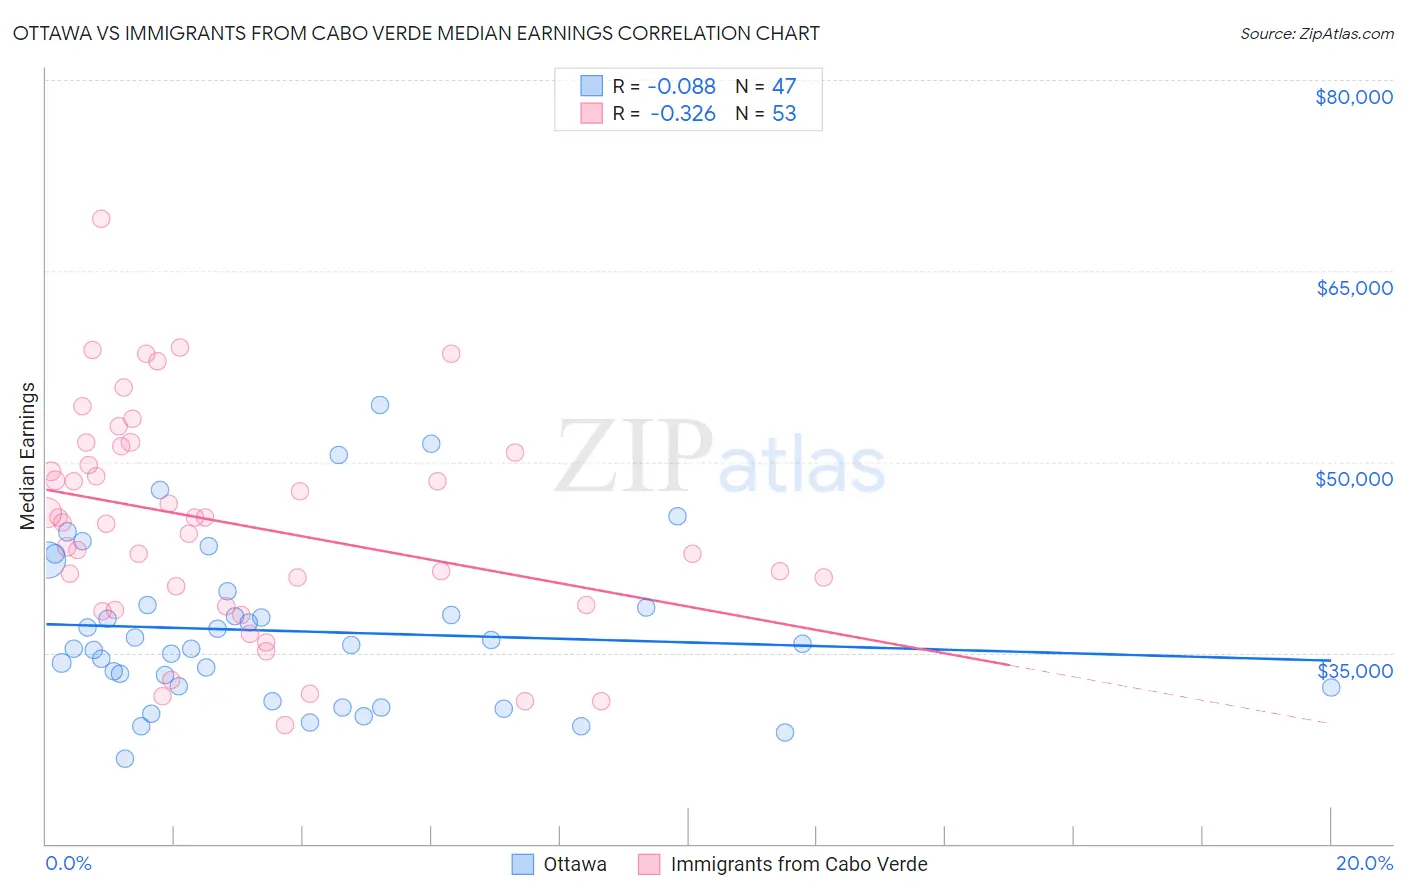
Ottawa vs Immigrants from Cabo Verde Median Earnings Correlation Chart
The statistical analysis conducted on geographies consisting of 49,956,035 people shows a slight negative correlation between the proportion of Ottawa and median earnings in the United States with a correlation coefficient (R) of -0.088 and weighted average of $39,721. Similarly, the statistical analysis conducted on geographies consisting of 38,158,666 people shows a mild negative correlation between the proportion of Immigrants from Cabo Verde and median earnings in the United States with a correlation coefficient (R) of -0.326 and weighted average of $43,963, a difference of 10.7%.
Median Earnings Correlation Summary
| Measurement | Ottawa | Immigrants from Cabo Verde |
| Minimum | $26,644 | $29,297 |
| Maximum | $54,444 | $69,097 |
| Range | $27,800 | $39,800 |
| Mean | $36,701 | $45,169 |
| Median | $35,608 | $45,280 |
| Interquartile 25% (IQ1) | $32,292 | $38,744 |
| Interquartile 75% (IQ3) | $38,794 | $50,961 |
| Interquartile Range (IQR) | $6,502 | $12,217 |
| Standard Deviation (Sample) | $6,309 | $8,556 |
| Standard Deviation (Population) | $6,241 | $8,475 |
Similar Demographics by Median Earnings
Demographics Similar to Ottawa by Median Earnings
In terms of median earnings, the demographic groups most similar to Ottawa are Bahamian ($39,735, a difference of 0.040%), Immigrants from Central America ($39,762, a difference of 0.10%), Creek ($39,648, a difference of 0.18%), Mexican ($39,834, a difference of 0.29%), and Immigrants from Bahamas ($39,861, a difference of 0.35%).
| Demographics | Rating | Rank | Median Earnings |
| Fijians | 0.0 /100 | #317 | Tragic $40,193 |
| Dutch West Indians | 0.0 /100 | #318 | Tragic $40,107 |
| Blacks/African Americans | 0.0 /100 | #319 | Tragic $40,085 |
| Immigrants | Bahamas | 0.0 /100 | #320 | Tragic $39,861 |
| Mexicans | 0.0 /100 | #321 | Tragic $39,834 |
| Immigrants | Central America | 0.0 /100 | #322 | Tragic $39,762 |
| Bahamians | 0.0 /100 | #323 | Tragic $39,735 |
| Ottawa | 0.0 /100 | #324 | Tragic $39,721 |
| Creek | 0.0 /100 | #325 | Tragic $39,648 |
| Immigrants | Yemen | 0.0 /100 | #326 | Tragic $39,540 |
| Yuman | 0.0 /100 | #327 | Tragic $39,523 |
| Sioux | 0.0 /100 | #328 | Tragic $39,448 |
| Kiowa | 0.0 /100 | #329 | Tragic $39,232 |
| Immigrants | Congo | 0.0 /100 | #330 | Tragic $39,169 |
| Immigrants | Mexico | 0.0 /100 | #331 | Tragic $39,114 |
Demographics Similar to Immigrants from Cabo Verde by Median Earnings
In terms of median earnings, the demographic groups most similar to Immigrants from Cabo Verde are Immigrants from West Indies ($43,989, a difference of 0.060%), Immigrants from Burma/Myanmar ($43,998, a difference of 0.080%), Nepalese ($43,860, a difference of 0.24%), Malaysian ($43,844, a difference of 0.27%), and Subsaharan African ($44,118, a difference of 0.35%).
| Demographics | Rating | Rank | Median Earnings |
| Aleuts | 4.4 /100 | #240 | Tragic $44,241 |
| Samoans | 4.2 /100 | #241 | Tragic $44,206 |
| Immigrants | Venezuela | 4.0 /100 | #242 | Tragic $44,163 |
| Sub-Saharan Africans | 3.7 /100 | #243 | Tragic $44,118 |
| Immigrants | Nonimmigrants | 3.7 /100 | #244 | Tragic $44,117 |
| Immigrants | Burma/Myanmar | 3.2 /100 | #245 | Tragic $43,998 |
| Immigrants | West Indies | 3.1 /100 | #246 | Tragic $43,989 |
| Immigrants | Cabo Verde | 3.0 /100 | #247 | Tragic $43,963 |
| Nepalese | 2.6 /100 | #248 | Tragic $43,860 |
| Malaysians | 2.6 /100 | #249 | Tragic $43,844 |
| Alaska Natives | 2.3 /100 | #250 | Tragic $43,750 |
| Tsimshian | 2.1 /100 | #251 | Tragic $43,695 |
| Hawaiians | 2.0 /100 | #252 | Tragic $43,673 |
| Somalis | 1.8 /100 | #253 | Tragic $43,567 |
| Liberians | 1.7 /100 | #254 | Tragic $43,536 |