Immigrants from Sudan vs Somali Median Earnings
COMPARE
Immigrants from Sudan
Somali
Median Earnings
Median Earnings Comparison
Immigrants from Sudan
Somalis
$44,767
MEDIAN EARNINGS
8.8/ 100
METRIC RATING
233rd/ 347
METRIC RANK
$43,567
MEDIAN EARNINGS
1.8/ 100
METRIC RATING
253rd/ 347
METRIC RANK
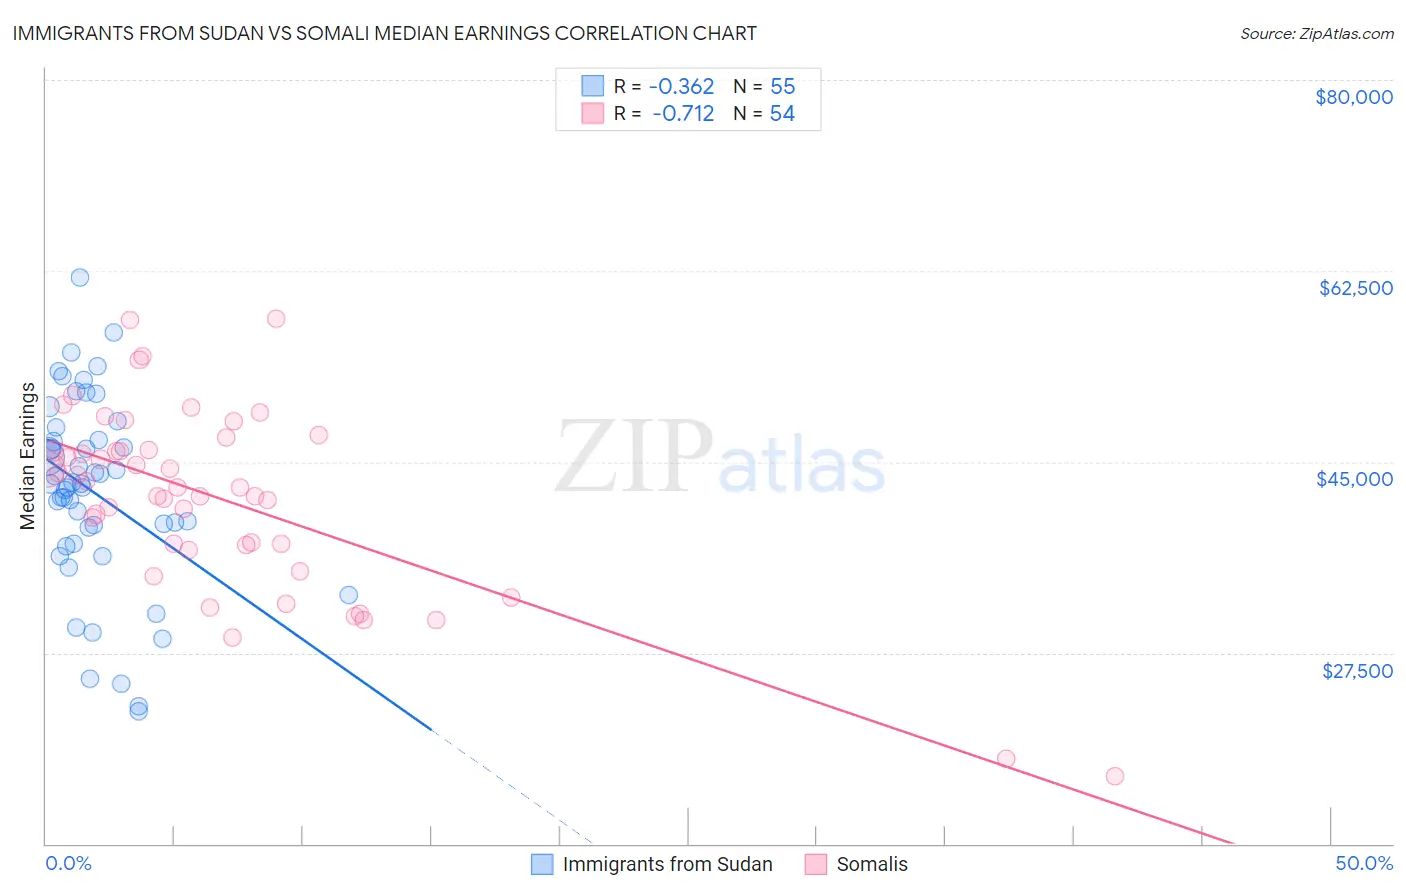
Immigrants from Sudan vs Somali Median Earnings Correlation Chart
The statistical analysis conducted on geographies consisting of 118,956,438 people shows a mild negative correlation between the proportion of Immigrants from Sudan and median earnings in the United States with a correlation coefficient (R) of -0.362 and weighted average of $44,767. Similarly, the statistical analysis conducted on geographies consisting of 99,321,613 people shows a strong negative correlation between the proportion of Somalis and median earnings in the United States with a correlation coefficient (R) of -0.712 and weighted average of $43,567, a difference of 2.8%.
Median Earnings Correlation Summary
| Measurement | Immigrants from Sudan | Somali |
| Minimum | $22,094 | $16,214 |
| Maximum | $61,886 | $58,125 |
| Range | $39,792 | $41,911 |
| Mean | $42,201 | $41,593 |
| Median | $42,956 | $42,677 |
| Interquartile 25% (IQ1) | $37,545 | $37,388 |
| Interquartile 75% (IQ3) | $47,029 | $46,056 |
| Interquartile Range (IQR) | $9,484 | $8,668 |
| Standard Deviation (Sample) | $8,696 | $8,542 |
| Standard Deviation (Population) | $8,617 | $8,463 |
Demographics Similar to Immigrants from Sudan and Somalis by Median Earnings
In terms of median earnings, the demographic groups most similar to Immigrants from Sudan are Cape Verdean ($44,640, a difference of 0.28%), Venezuelan ($44,580, a difference of 0.42%), British West Indian ($44,552, a difference of 0.48%), Immigrants from Ecuador ($44,462, a difference of 0.69%), and Sudanese ($44,419, a difference of 0.78%). Similarly, the demographic groups most similar to Somalis are Hawaiian ($43,673, a difference of 0.24%), Tsimshian ($43,695, a difference of 0.30%), Alaska Native ($43,750, a difference of 0.42%), Malaysian ($43,844, a difference of 0.64%), and Nepalese ($43,860, a difference of 0.67%).
| Demographics | Rating | Rank | Median Earnings |
| Immigrants | Sudan | 8.8 /100 | #233 | Tragic $44,767 |
| Cape Verdeans | 7.5 /100 | #234 | Tragic $44,640 |
| Venezuelans | 6.9 /100 | #235 | Tragic $44,580 |
| British West Indians | 6.7 /100 | #236 | Tragic $44,552 |
| Immigrants | Ecuador | 5.9 /100 | #237 | Tragic $44,462 |
| Sudanese | 5.6 /100 | #238 | Tragic $44,419 |
| Senegalese | 5.3 /100 | #239 | Tragic $44,373 |
| Aleuts | 4.4 /100 | #240 | Tragic $44,241 |
| Samoans | 4.2 /100 | #241 | Tragic $44,206 |
| Immigrants | Venezuela | 4.0 /100 | #242 | Tragic $44,163 |
| Sub-Saharan Africans | 3.7 /100 | #243 | Tragic $44,118 |
| Immigrants | Nonimmigrants | 3.7 /100 | #244 | Tragic $44,117 |
| Immigrants | Burma/Myanmar | 3.2 /100 | #245 | Tragic $43,998 |
| Immigrants | West Indies | 3.1 /100 | #246 | Tragic $43,989 |
| Immigrants | Cabo Verde | 3.0 /100 | #247 | Tragic $43,963 |
| Nepalese | 2.6 /100 | #248 | Tragic $43,860 |
| Malaysians | 2.6 /100 | #249 | Tragic $43,844 |
| Alaska Natives | 2.3 /100 | #250 | Tragic $43,750 |
| Tsimshian | 2.1 /100 | #251 | Tragic $43,695 |
| Hawaiians | 2.0 /100 | #252 | Tragic $43,673 |
| Somalis | 1.8 /100 | #253 | Tragic $43,567 |