Macedonian vs Immigrants from Cabo Verde Median Earnings
COMPARE
Macedonian
Immigrants from Cabo Verde
Median Earnings
Median Earnings Comparison
Macedonians
Immigrants from Cabo Verde
$49,893
MEDIAN EARNINGS
99.2/ 100
METRIC RATING
91st/ 347
METRIC RANK
$43,963
MEDIAN EARNINGS
3.0/ 100
METRIC RATING
247th/ 347
METRIC RANK
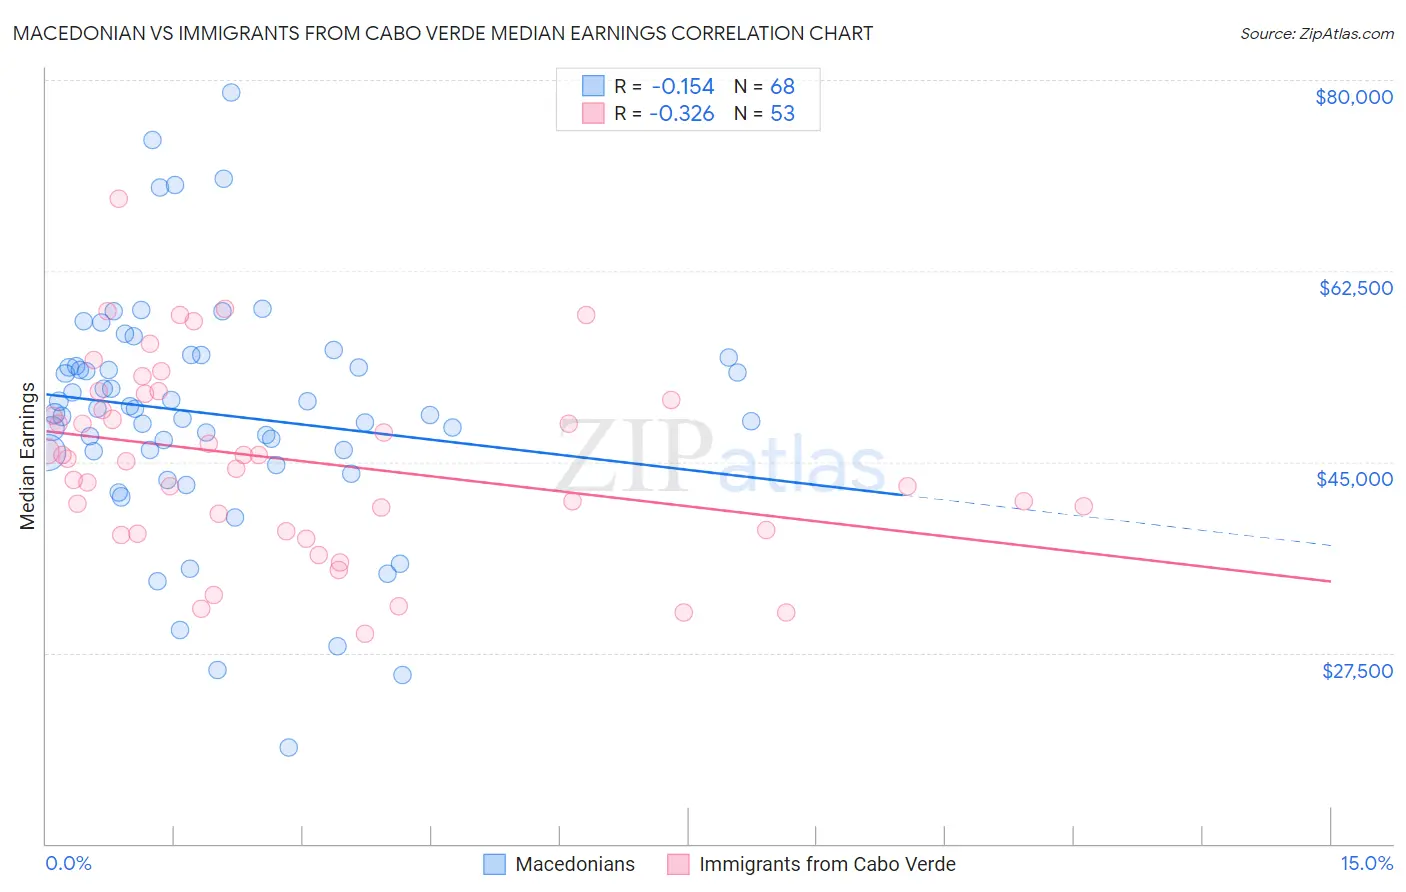
Macedonian vs Immigrants from Cabo Verde Median Earnings Correlation Chart
The statistical analysis conducted on geographies consisting of 132,586,624 people shows a poor negative correlation between the proportion of Macedonians and median earnings in the United States with a correlation coefficient (R) of -0.154 and weighted average of $49,893. Similarly, the statistical analysis conducted on geographies consisting of 38,158,666 people shows a mild negative correlation between the proportion of Immigrants from Cabo Verde and median earnings in the United States with a correlation coefficient (R) of -0.326 and weighted average of $43,963, a difference of 13.5%.
Median Earnings Correlation Summary
| Measurement | Macedonian | Immigrants from Cabo Verde |
| Minimum | $18,816 | $29,297 |
| Maximum | $78,907 | $69,097 |
| Range | $60,091 | $39,800 |
| Mean | $49,392 | $45,169 |
| Median | $49,655 | $45,280 |
| Interquartile 25% (IQ1) | $45,965 | $38,744 |
| Interquartile 75% (IQ3) | $54,145 | $50,961 |
| Interquartile Range (IQR) | $8,180 | $12,217 |
| Standard Deviation (Sample) | $10,833 | $8,556 |
| Standard Deviation (Population) | $10,753 | $8,475 |
Similar Demographics by Median Earnings
Demographics Similar to Macedonians by Median Earnings
In terms of median earnings, the demographic groups most similar to Macedonians are Italian ($49,915, a difference of 0.040%), Immigrants from Argentina ($49,841, a difference of 0.11%), Armenian ($49,804, a difference of 0.18%), Croatian ($49,724, a difference of 0.34%), and Immigrants from England ($49,722, a difference of 0.34%).
| Demographics | Rating | Rank | Median Earnings |
| Immigrants | Hungary | 99.5 /100 | #84 | Exceptional $50,227 |
| Immigrants | Kazakhstan | 99.5 /100 | #85 | Exceptional $50,225 |
| Immigrants | Canada | 99.5 /100 | #86 | Exceptional $50,192 |
| Immigrants | Uzbekistan | 99.5 /100 | #87 | Exceptional $50,151 |
| Albanians | 99.4 /100 | #88 | Exceptional $50,116 |
| Immigrants | North America | 99.4 /100 | #89 | Exceptional $50,108 |
| Italians | 99.3 /100 | #90 | Exceptional $49,915 |
| Macedonians | 99.2 /100 | #91 | Exceptional $49,893 |
| Immigrants | Argentina | 99.2 /100 | #92 | Exceptional $49,841 |
| Armenians | 99.1 /100 | #93 | Exceptional $49,804 |
| Croatians | 99.0 /100 | #94 | Exceptional $49,724 |
| Immigrants | England | 99.0 /100 | #95 | Exceptional $49,722 |
| Immigrants | Lebanon | 99.0 /100 | #96 | Exceptional $49,682 |
| Immigrants | North Macedonia | 98.9 /100 | #97 | Exceptional $49,658 |
| Immigrants | Northern Africa | 98.9 /100 | #98 | Exceptional $49,648 |
Demographics Similar to Immigrants from Cabo Verde by Median Earnings
In terms of median earnings, the demographic groups most similar to Immigrants from Cabo Verde are Immigrants from West Indies ($43,989, a difference of 0.060%), Immigrants from Burma/Myanmar ($43,998, a difference of 0.080%), Nepalese ($43,860, a difference of 0.24%), Malaysian ($43,844, a difference of 0.27%), and Subsaharan African ($44,118, a difference of 0.35%).
| Demographics | Rating | Rank | Median Earnings |
| Aleuts | 4.4 /100 | #240 | Tragic $44,241 |
| Samoans | 4.2 /100 | #241 | Tragic $44,206 |
| Immigrants | Venezuela | 4.0 /100 | #242 | Tragic $44,163 |
| Sub-Saharan Africans | 3.7 /100 | #243 | Tragic $44,118 |
| Immigrants | Nonimmigrants | 3.7 /100 | #244 | Tragic $44,117 |
| Immigrants | Burma/Myanmar | 3.2 /100 | #245 | Tragic $43,998 |
| Immigrants | West Indies | 3.1 /100 | #246 | Tragic $43,989 |
| Immigrants | Cabo Verde | 3.0 /100 | #247 | Tragic $43,963 |
| Nepalese | 2.6 /100 | #248 | Tragic $43,860 |
| Malaysians | 2.6 /100 | #249 | Tragic $43,844 |
| Alaska Natives | 2.3 /100 | #250 | Tragic $43,750 |
| Tsimshian | 2.1 /100 | #251 | Tragic $43,695 |
| Hawaiians | 2.0 /100 | #252 | Tragic $43,673 |
| Somalis | 1.8 /100 | #253 | Tragic $43,567 |
| Liberians | 1.7 /100 | #254 | Tragic $43,536 |