Immigrants from Sudan vs Central American Median Earnings
COMPARE
Immigrants from Sudan
Central American
Median Earnings
Median Earnings Comparison
Immigrants from Sudan
Central Americans
$44,767
MEDIAN EARNINGS
8.8/ 100
METRIC RATING
233rd/ 347
METRIC RANK
$42,280
MEDIAN EARNINGS
0.3/ 100
METRIC RATING
277th/ 347
METRIC RANK
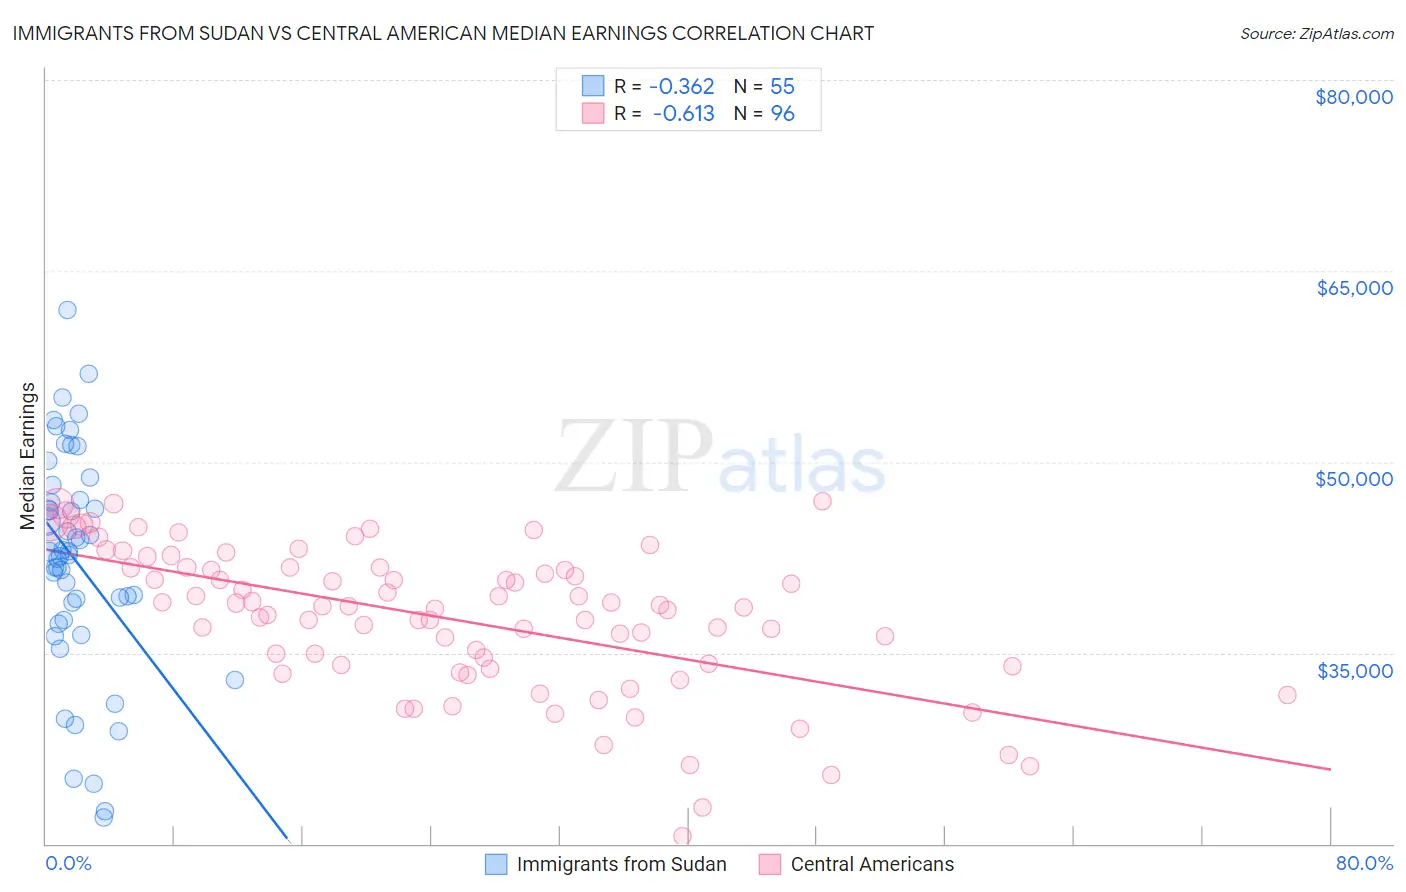
Immigrants from Sudan vs Central American Median Earnings Correlation Chart
The statistical analysis conducted on geographies consisting of 118,956,438 people shows a mild negative correlation between the proportion of Immigrants from Sudan and median earnings in the United States with a correlation coefficient (R) of -0.362 and weighted average of $44,767. Similarly, the statistical analysis conducted on geographies consisting of 504,567,370 people shows a significant negative correlation between the proportion of Central Americans and median earnings in the United States with a correlation coefficient (R) of -0.613 and weighted average of $42,280, a difference of 5.9%.
Median Earnings Correlation Summary
| Measurement | Immigrants from Sudan | Central American |
| Minimum | $22,094 | $20,583 |
| Maximum | $61,886 | $46,875 |
| Range | $39,792 | $26,292 |
| Mean | $42,201 | $37,665 |
| Median | $42,956 | $38,592 |
| Interquartile 25% (IQ1) | $37,545 | $34,004 |
| Interquartile 75% (IQ3) | $47,029 | $41,685 |
| Interquartile Range (IQR) | $9,484 | $7,681 |
| Standard Deviation (Sample) | $8,696 | $5,685 |
| Standard Deviation (Population) | $8,617 | $5,655 |
Similar Demographics by Median Earnings
Demographics Similar to Immigrants from Sudan by Median Earnings
In terms of median earnings, the demographic groups most similar to Immigrants from Sudan are Delaware ($44,783, a difference of 0.040%), Japanese ($44,825, a difference of 0.13%), Immigrants from Western Africa ($44,893, a difference of 0.28%), Cape Verdean ($44,640, a difference of 0.28%), and Scotch-Irish ($44,924, a difference of 0.35%).
| Demographics | Rating | Rank | Median Earnings |
| Immigrants | Nigeria | 12.2 /100 | #226 | Poor $45,030 |
| Native Hawaiians | 12.2 /100 | #227 | Poor $45,027 |
| Immigrants | Iraq | 11.6 /100 | #228 | Poor $44,988 |
| Scotch-Irish | 10.7 /100 | #229 | Poor $44,924 |
| Immigrants | Western Africa | 10.3 /100 | #230 | Poor $44,893 |
| Japanese | 9.5 /100 | #231 | Tragic $44,825 |
| Delaware | 9.0 /100 | #232 | Tragic $44,783 |
| Immigrants | Sudan | 8.8 /100 | #233 | Tragic $44,767 |
| Cape Verdeans | 7.5 /100 | #234 | Tragic $44,640 |
| Venezuelans | 6.9 /100 | #235 | Tragic $44,580 |
| British West Indians | 6.7 /100 | #236 | Tragic $44,552 |
| Immigrants | Ecuador | 5.9 /100 | #237 | Tragic $44,462 |
| Sudanese | 5.6 /100 | #238 | Tragic $44,419 |
| Senegalese | 5.3 /100 | #239 | Tragic $44,373 |
| Aleuts | 4.4 /100 | #240 | Tragic $44,241 |
Demographics Similar to Central Americans by Median Earnings
In terms of median earnings, the demographic groups most similar to Central Americans are Spanish American ($42,316, a difference of 0.090%), Immigrants from Belize ($42,339, a difference of 0.14%), Cajun ($42,189, a difference of 0.21%), Colville ($42,151, a difference of 0.31%), and Immigrants from El Salvador ($42,413, a difference of 0.32%).
| Demographics | Rating | Rank | Median Earnings |
| Osage | 0.5 /100 | #270 | Tragic $42,651 |
| Pennsylvania Germans | 0.5 /100 | #271 | Tragic $42,615 |
| Iroquois | 0.4 /100 | #272 | Tragic $42,430 |
| Immigrants | Dominica | 0.4 /100 | #273 | Tragic $42,420 |
| Immigrants | El Salvador | 0.4 /100 | #274 | Tragic $42,413 |
| Immigrants | Belize | 0.3 /100 | #275 | Tragic $42,339 |
| Spanish Americans | 0.3 /100 | #276 | Tragic $42,316 |
| Central Americans | 0.3 /100 | #277 | Tragic $42,280 |
| Cajuns | 0.3 /100 | #278 | Tragic $42,189 |
| Colville | 0.2 /100 | #279 | Tragic $42,151 |
| Hmong | 0.2 /100 | #280 | Tragic $42,111 |
| Marshallese | 0.2 /100 | #281 | Tragic $41,969 |
| Africans | 0.2 /100 | #282 | Tragic $41,955 |
| Dominicans | 0.2 /100 | #283 | Tragic $41,864 |
| Blackfeet | 0.2 /100 | #284 | Tragic $41,822 |