Immigrants from Sudan vs Immigrants from Cabo Verde Disability Age Under 5
COMPARE
Immigrants from Sudan
Immigrants from Cabo Verde
Disability Age Under 5
Disability Age Under 5 Comparison
Immigrants from Sudan
Immigrants from Cabo Verde
1.3%
DISABILITY AGE UNDER 5
18.7/ 100
METRIC RATING
213th/ 347
METRIC RANK
1.7%
DISABILITY AGE UNDER 5
0.0/ 100
METRIC RATING
316th/ 347
METRIC RANK
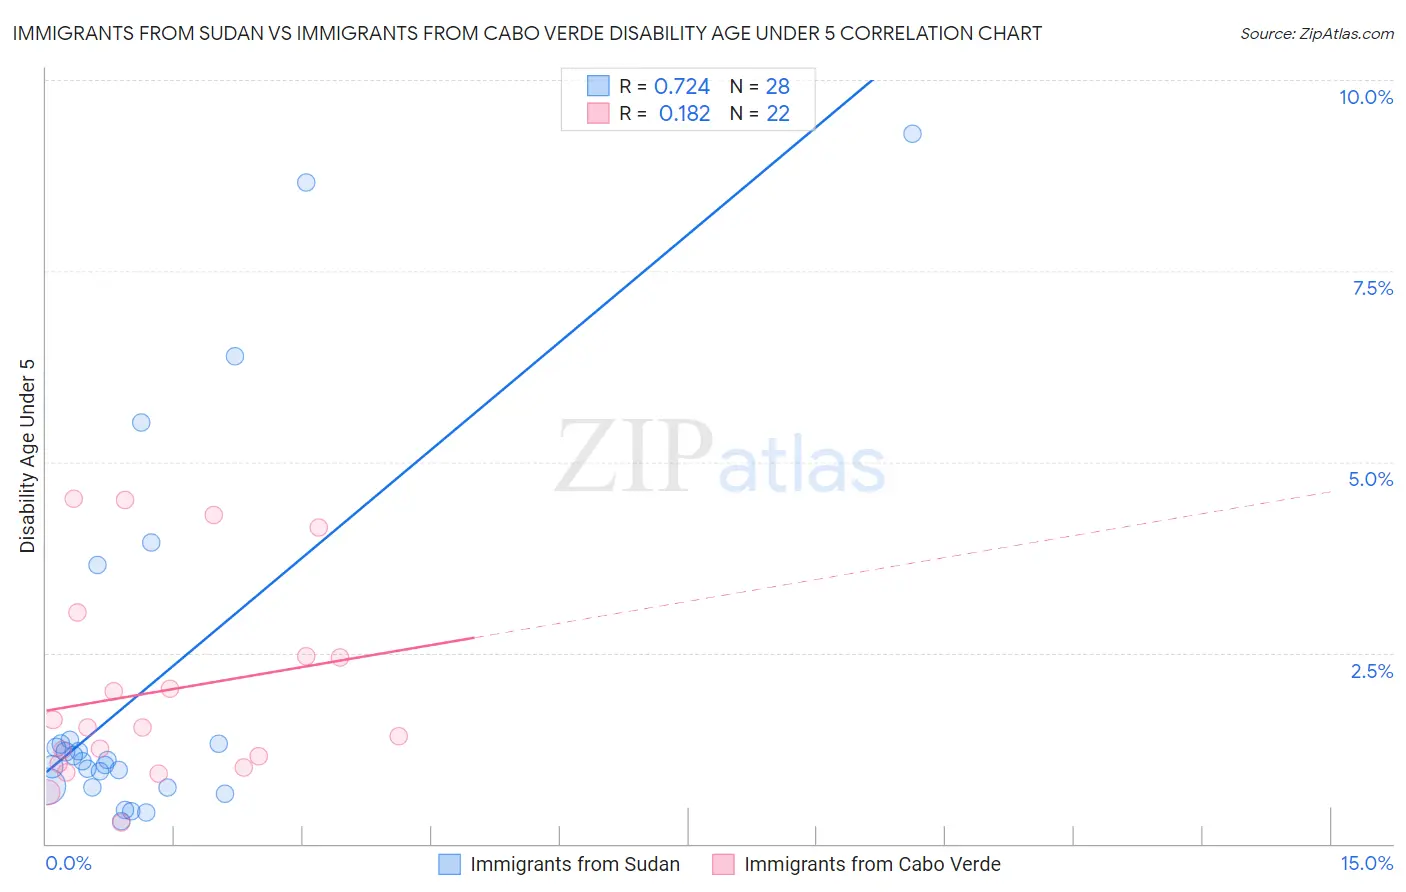
Immigrants from Sudan vs Immigrants from Cabo Verde Disability Age Under 5 Correlation Chart
The statistical analysis conducted on geographies consisting of 92,125,670 people shows a strong positive correlation between the proportion of Immigrants from Sudan and percentage of population with a disability under the age of 5 in the United States with a correlation coefficient (R) of 0.724 and weighted average of 1.3%. Similarly, the statistical analysis conducted on geographies consisting of 31,314,274 people shows a poor positive correlation between the proportion of Immigrants from Cabo Verde and percentage of population with a disability under the age of 5 in the United States with a correlation coefficient (R) of 0.182 and weighted average of 1.7%, a difference of 31.4%.
Disability Age Under 5 Correlation Summary
| Measurement | Immigrants from Sudan | Immigrants from Cabo Verde |
| Minimum | 0.29% | 0.28% |
| Maximum | 9.3% | 4.5% |
| Range | 9.0% | 4.2% |
| Mean | 2.1% | 2.0% |
| Median | 1.1% | 1.5% |
| Interquartile 25% (IQ1) | 0.74% | 1.0% |
| Interquartile 75% (IQ3) | 1.3% | 2.4% |
| Interquartile Range (IQR) | 0.60% | 1.4% |
| Standard Deviation (Sample) | 2.5% | 1.3% |
| Standard Deviation (Population) | 2.4% | 1.3% |
Similar Demographics by Disability Age Under 5
Demographics Similar to Immigrants from Sudan by Disability Age Under 5
In terms of disability age under 5, the demographic groups most similar to Immigrants from Sudan are Chilean (1.3%, a difference of 0.010%), Immigrants from Greece (1.3%, a difference of 0.060%), Pakistani (1.3%, a difference of 0.10%), Bulgarian (1.3%, a difference of 0.11%), and Immigrants from Chile (1.3%, a difference of 0.23%).
| Demographics | Rating | Rank | Disability Age Under 5 |
| Immigrants | Poland | 22.4 /100 | #206 | Fair 1.3% |
| Nigerians | 21.2 /100 | #207 | Fair 1.3% |
| Mexicans | 20.8 /100 | #208 | Fair 1.3% |
| Bulgarians | 19.5 /100 | #209 | Poor 1.3% |
| Pakistanis | 19.4 /100 | #210 | Poor 1.3% |
| Immigrants | Greece | 19.1 /100 | #211 | Poor 1.3% |
| Chileans | 18.8 /100 | #212 | Poor 1.3% |
| Immigrants | Sudan | 18.7 /100 | #213 | Poor 1.3% |
| Immigrants | Chile | 17.2 /100 | #214 | Poor 1.3% |
| Syrians | 16.1 /100 | #215 | Poor 1.3% |
| Bangladeshis | 15.5 /100 | #216 | Poor 1.3% |
| Cypriots | 14.9 /100 | #217 | Poor 1.3% |
| Malaysians | 13.2 /100 | #218 | Poor 1.3% |
| Immigrants | Croatia | 11.2 /100 | #219 | Poor 1.3% |
| Serbians | 9.6 /100 | #220 | Tragic 1.3% |
Demographics Similar to Immigrants from Cabo Verde by Disability Age Under 5
In terms of disability age under 5, the demographic groups most similar to Immigrants from Cabo Verde are Dutch (1.7%, a difference of 0.18%), French (1.7%, a difference of 0.42%), Norwegian (1.7%, a difference of 0.44%), Celtic (1.7%, a difference of 0.60%), and Irish (1.7%, a difference of 0.69%).
| Demographics | Rating | Rank | Disability Age Under 5 |
| Cape Verdeans | 0.0 /100 | #309 | Tragic 1.7% |
| Whites/Caucasians | 0.0 /100 | #310 | Tragic 1.7% |
| English | 0.0 /100 | #311 | Tragic 1.7% |
| Puerto Ricans | 0.0 /100 | #312 | Tragic 1.7% |
| Celtics | 0.0 /100 | #313 | Tragic 1.7% |
| Norwegians | 0.0 /100 | #314 | Tragic 1.7% |
| Dutch | 0.0 /100 | #315 | Tragic 1.7% |
| Immigrants | Cabo Verde | 0.0 /100 | #316 | Tragic 1.7% |
| French | 0.0 /100 | #317 | Tragic 1.7% |
| Irish | 0.0 /100 | #318 | Tragic 1.7% |
| Slovaks | 0.0 /100 | #319 | Tragic 1.7% |
| Scotch-Irish | 0.0 /100 | #320 | Tragic 1.7% |
| Ottawa | 0.0 /100 | #321 | Tragic 1.7% |
| Germans | 0.0 /100 | #322 | Tragic 1.7% |
| Chickasaw | 0.0 /100 | #323 | Tragic 1.7% |