Immigrants from Sierra Leone vs Immigrants from Cabo Verde Median Earnings
COMPARE
Immigrants from Sierra Leone
Immigrants from Cabo Verde
Median Earnings
Median Earnings Comparison
Immigrants from Sierra Leone
Immigrants from Cabo Verde
$47,875
MEDIAN EARNINGS
88.3/ 100
METRIC RATING
141st/ 347
METRIC RANK
$43,963
MEDIAN EARNINGS
3.0/ 100
METRIC RATING
247th/ 347
METRIC RANK
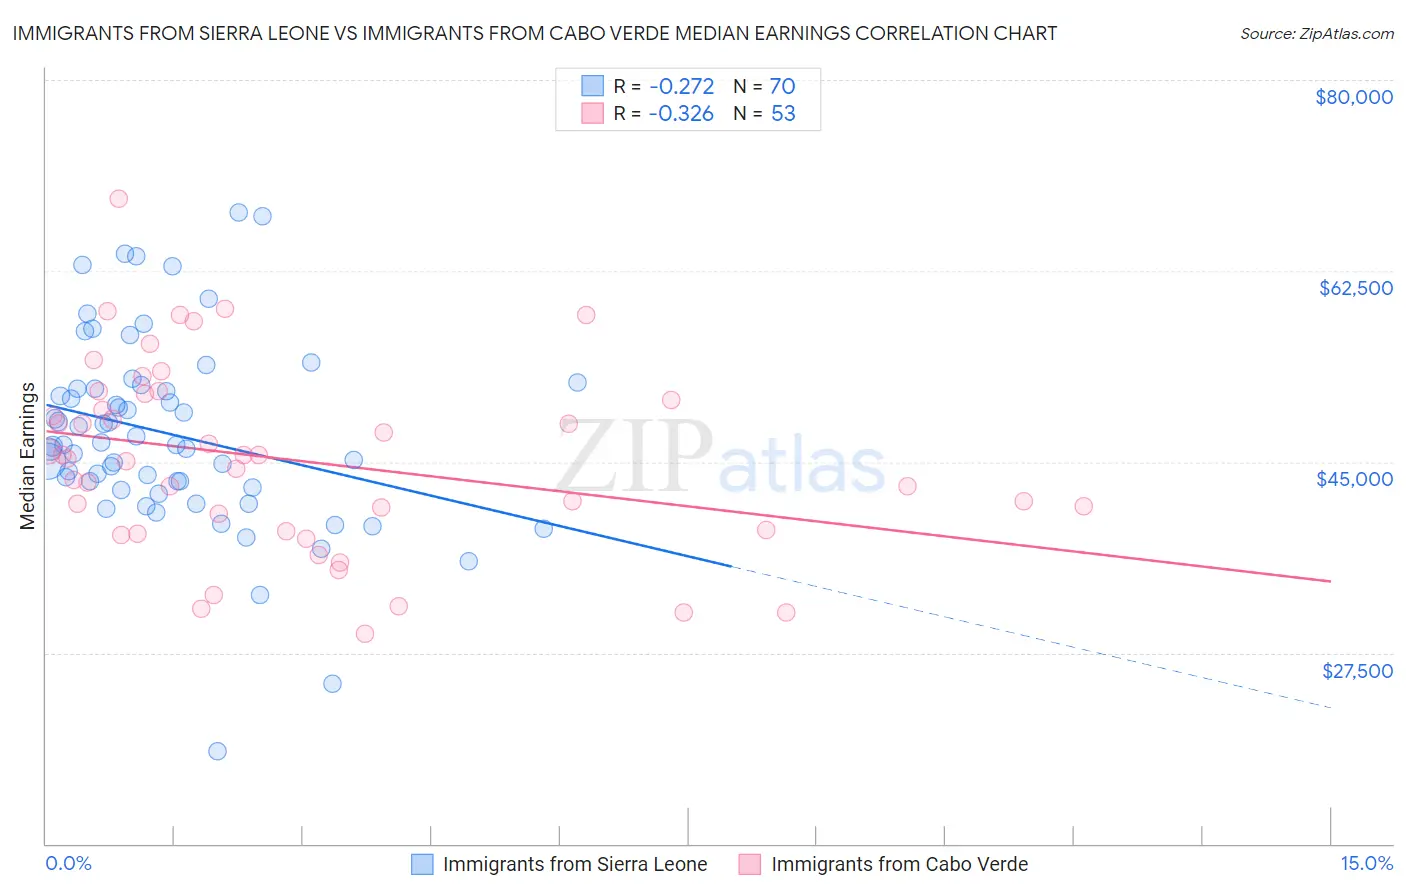
Immigrants from Sierra Leone vs Immigrants from Cabo Verde Median Earnings Correlation Chart
The statistical analysis conducted on geographies consisting of 101,648,548 people shows a weak negative correlation between the proportion of Immigrants from Sierra Leone and median earnings in the United States with a correlation coefficient (R) of -0.272 and weighted average of $47,875. Similarly, the statistical analysis conducted on geographies consisting of 38,158,666 people shows a mild negative correlation between the proportion of Immigrants from Cabo Verde and median earnings in the United States with a correlation coefficient (R) of -0.326 and weighted average of $43,963, a difference of 8.9%.
Median Earnings Correlation Summary
| Measurement | Immigrants from Sierra Leone | Immigrants from Cabo Verde |
| Minimum | $18,466 | $29,297 |
| Maximum | $67,883 | $69,097 |
| Range | $49,417 | $39,800 |
| Mean | $47,536 | $45,169 |
| Median | $46,582 | $45,280 |
| Interquartile 25% (IQ1) | $42,603 | $38,744 |
| Interquartile 75% (IQ3) | $51,717 | $50,961 |
| Interquartile Range (IQR) | $9,114 | $12,217 |
| Standard Deviation (Sample) | $8,851 | $8,556 |
| Standard Deviation (Population) | $8,787 | $8,475 |
Similar Demographics by Median Earnings
Demographics Similar to Immigrants from Sierra Leone by Median Earnings
In terms of median earnings, the demographic groups most similar to Immigrants from Sierra Leone are Ugandan ($47,854, a difference of 0.040%), Swedish ($47,851, a difference of 0.050%), Taiwanese ($47,902, a difference of 0.060%), European ($47,915, a difference of 0.080%), and Canadian ($47,911, a difference of 0.080%).
| Demographics | Rating | Rank | Median Earnings |
| Sri Lankans | 90.5 /100 | #134 | Exceptional $48,040 |
| Portuguese | 90.4 /100 | #135 | Exceptional $48,032 |
| Slovenes | 90.0 /100 | #136 | Excellent $47,995 |
| Immigrants | Nepal | 89.0 /100 | #137 | Excellent $47,925 |
| Europeans | 88.9 /100 | #138 | Excellent $47,915 |
| Canadians | 88.8 /100 | #139 | Excellent $47,911 |
| Taiwanese | 88.7 /100 | #140 | Excellent $47,902 |
| Immigrants | Sierra Leone | 88.3 /100 | #141 | Excellent $47,875 |
| Ugandans | 88.0 /100 | #142 | Excellent $47,854 |
| Swedes | 88.0 /100 | #143 | Excellent $47,851 |
| Hungarians | 87.1 /100 | #144 | Excellent $47,795 |
| Immigrants | Saudi Arabia | 85.6 /100 | #145 | Excellent $47,704 |
| Immigrants | Chile | 85.5 /100 | #146 | Excellent $47,697 |
| Immigrants | South Eastern Asia | 85.0 /100 | #147 | Excellent $47,671 |
| Immigrants | Eritrea | 84.8 /100 | #148 | Excellent $47,657 |
Demographics Similar to Immigrants from Cabo Verde by Median Earnings
In terms of median earnings, the demographic groups most similar to Immigrants from Cabo Verde are Immigrants from West Indies ($43,989, a difference of 0.060%), Immigrants from Burma/Myanmar ($43,998, a difference of 0.080%), Nepalese ($43,860, a difference of 0.24%), Malaysian ($43,844, a difference of 0.27%), and Subsaharan African ($44,118, a difference of 0.35%).
| Demographics | Rating | Rank | Median Earnings |
| Aleuts | 4.4 /100 | #240 | Tragic $44,241 |
| Samoans | 4.2 /100 | #241 | Tragic $44,206 |
| Immigrants | Venezuela | 4.0 /100 | #242 | Tragic $44,163 |
| Sub-Saharan Africans | 3.7 /100 | #243 | Tragic $44,118 |
| Immigrants | Nonimmigrants | 3.7 /100 | #244 | Tragic $44,117 |
| Immigrants | Burma/Myanmar | 3.2 /100 | #245 | Tragic $43,998 |
| Immigrants | West Indies | 3.1 /100 | #246 | Tragic $43,989 |
| Immigrants | Cabo Verde | 3.0 /100 | #247 | Tragic $43,963 |
| Nepalese | 2.6 /100 | #248 | Tragic $43,860 |
| Malaysians | 2.6 /100 | #249 | Tragic $43,844 |
| Alaska Natives | 2.3 /100 | #250 | Tragic $43,750 |
| Tsimshian | 2.1 /100 | #251 | Tragic $43,695 |
| Hawaiians | 2.0 /100 | #252 | Tragic $43,673 |
| Somalis | 1.8 /100 | #253 | Tragic $43,567 |
| Liberians | 1.7 /100 | #254 | Tragic $43,536 |