White/Caucasian vs Immigrants from Cabo Verde Median Earnings
COMPARE
White/Caucasian
Immigrants from Cabo Verde
Median Earnings
Median Earnings Comparison
Whites/Caucasians
Immigrants from Cabo Verde
$45,197
MEDIAN EARNINGS
15.0/ 100
METRIC RATING
223rd/ 347
METRIC RANK
$43,963
MEDIAN EARNINGS
3.0/ 100
METRIC RATING
247th/ 347
METRIC RANK
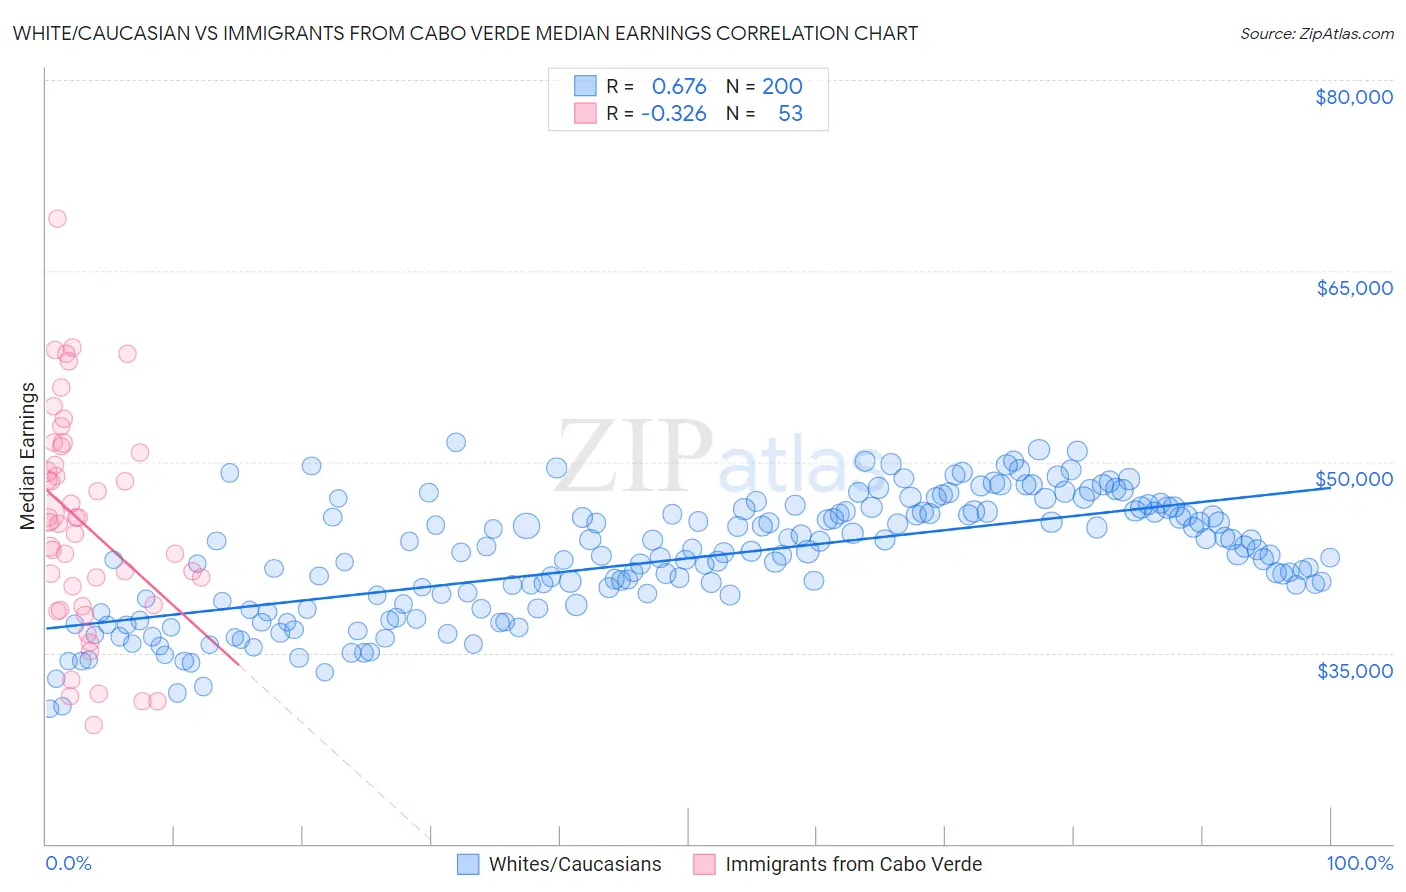
White/Caucasian vs Immigrants from Cabo Verde Median Earnings Correlation Chart
The statistical analysis conducted on geographies consisting of 584,189,858 people shows a significant positive correlation between the proportion of Whites/Caucasians and median earnings in the United States with a correlation coefficient (R) of 0.676 and weighted average of $45,197. Similarly, the statistical analysis conducted on geographies consisting of 38,158,666 people shows a mild negative correlation between the proportion of Immigrants from Cabo Verde and median earnings in the United States with a correlation coefficient (R) of -0.326 and weighted average of $43,963, a difference of 2.8%.
Median Earnings Correlation Summary
| Measurement | White/Caucasian | Immigrants from Cabo Verde |
| Minimum | $30,625 | $29,297 |
| Maximum | $51,538 | $69,097 |
| Range | $20,913 | $39,800 |
| Mean | $42,432 | $45,169 |
| Median | $42,807 | $45,280 |
| Interquartile 25% (IQ1) | $38,641 | $38,744 |
| Interquartile 75% (IQ3) | $46,089 | $50,961 |
| Interquartile Range (IQR) | $7,448 | $12,217 |
| Standard Deviation (Sample) | $4,733 | $8,556 |
| Standard Deviation (Population) | $4,721 | $8,475 |
Similar Demographics by Median Earnings
Demographics Similar to Whites/Caucasians by Median Earnings
In terms of median earnings, the demographic groups most similar to Whites/Caucasians are Immigrants from Panama ($45,198, a difference of 0.0%), Immigrants from Guyana ($45,204, a difference of 0.020%), Ecuadorian ($45,214, a difference of 0.040%), West Indian ($45,132, a difference of 0.15%), and Immigrants from Cambodia ($45,090, a difference of 0.24%).
| Demographics | Rating | Rank | Median Earnings |
| Guyanese | 20.6 /100 | #216 | Fair $45,470 |
| Tlingit-Haida | 20.5 /100 | #217 | Fair $45,468 |
| Spanish | 19.7 /100 | #218 | Poor $45,432 |
| Dutch | 18.4 /100 | #219 | Poor $45,370 |
| Ecuadorians | 15.3 /100 | #220 | Poor $45,214 |
| Immigrants | Guyana | 15.1 /100 | #221 | Poor $45,204 |
| Immigrants | Panama | 15.0 /100 | #222 | Poor $45,198 |
| Whites/Caucasians | 15.0 /100 | #223 | Poor $45,197 |
| West Indians | 13.9 /100 | #224 | Poor $45,132 |
| Immigrants | Cambodia | 13.2 /100 | #225 | Poor $45,090 |
| Immigrants | Nigeria | 12.2 /100 | #226 | Poor $45,030 |
| Native Hawaiians | 12.2 /100 | #227 | Poor $45,027 |
| Immigrants | Iraq | 11.6 /100 | #228 | Poor $44,988 |
| Scotch-Irish | 10.7 /100 | #229 | Poor $44,924 |
| Immigrants | Western Africa | 10.3 /100 | #230 | Poor $44,893 |
Demographics Similar to Immigrants from Cabo Verde by Median Earnings
In terms of median earnings, the demographic groups most similar to Immigrants from Cabo Verde are Immigrants from West Indies ($43,989, a difference of 0.060%), Immigrants from Burma/Myanmar ($43,998, a difference of 0.080%), Nepalese ($43,860, a difference of 0.24%), Malaysian ($43,844, a difference of 0.27%), and Subsaharan African ($44,118, a difference of 0.35%).
| Demographics | Rating | Rank | Median Earnings |
| Aleuts | 4.4 /100 | #240 | Tragic $44,241 |
| Samoans | 4.2 /100 | #241 | Tragic $44,206 |
| Immigrants | Venezuela | 4.0 /100 | #242 | Tragic $44,163 |
| Sub-Saharan Africans | 3.7 /100 | #243 | Tragic $44,118 |
| Immigrants | Nonimmigrants | 3.7 /100 | #244 | Tragic $44,117 |
| Immigrants | Burma/Myanmar | 3.2 /100 | #245 | Tragic $43,998 |
| Immigrants | West Indies | 3.1 /100 | #246 | Tragic $43,989 |
| Immigrants | Cabo Verde | 3.0 /100 | #247 | Tragic $43,963 |
| Nepalese | 2.6 /100 | #248 | Tragic $43,860 |
| Malaysians | 2.6 /100 | #249 | Tragic $43,844 |
| Alaska Natives | 2.3 /100 | #250 | Tragic $43,750 |
| Tsimshian | 2.1 /100 | #251 | Tragic $43,695 |
| Hawaiians | 2.0 /100 | #252 | Tragic $43,673 |
| Somalis | 1.8 /100 | #253 | Tragic $43,567 |
| Liberians | 1.7 /100 | #254 | Tragic $43,536 |