Immigrants from Spain vs Immigrants from Cabo Verde Median Earnings
COMPARE
Immigrants from Spain
Immigrants from Cabo Verde
Median Earnings
Median Earnings Comparison
Immigrants from Spain
Immigrants from Cabo Verde
$51,092
MEDIAN EARNINGS
99.9/ 100
METRIC RATING
67th/ 347
METRIC RANK
$43,963
MEDIAN EARNINGS
3.0/ 100
METRIC RATING
247th/ 347
METRIC RANK
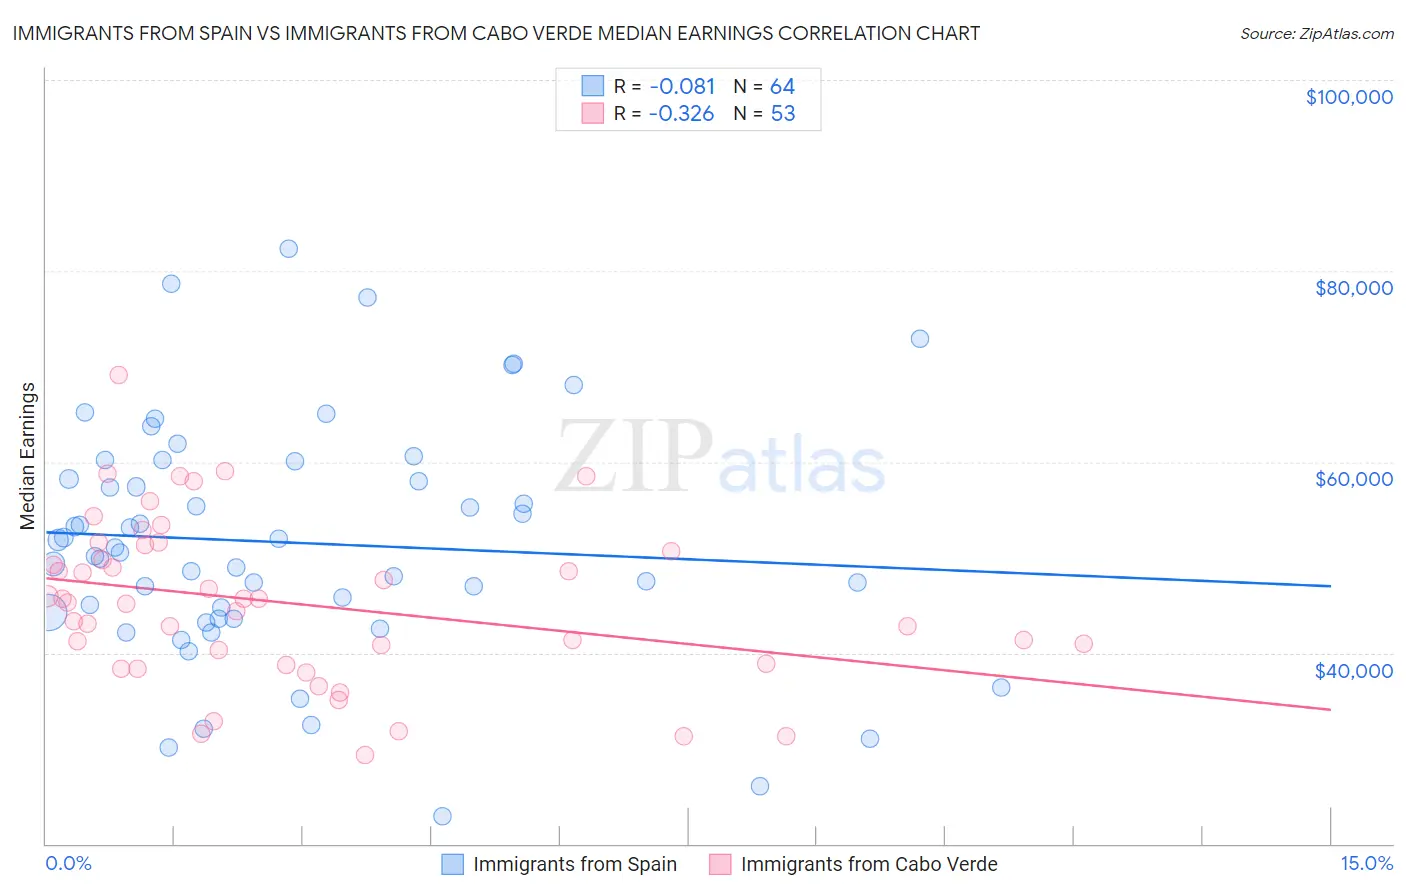
Immigrants from Spain vs Immigrants from Cabo Verde Median Earnings Correlation Chart
The statistical analysis conducted on geographies consisting of 239,665,603 people shows a slight negative correlation between the proportion of Immigrants from Spain and median earnings in the United States with a correlation coefficient (R) of -0.081 and weighted average of $51,092. Similarly, the statistical analysis conducted on geographies consisting of 38,158,666 people shows a mild negative correlation between the proportion of Immigrants from Cabo Verde and median earnings in the United States with a correlation coefficient (R) of -0.326 and weighted average of $43,963, a difference of 16.2%.
Median Earnings Correlation Summary
| Measurement | Immigrants from Spain | Immigrants from Cabo Verde |
| Minimum | $22,920 | $29,297 |
| Maximum | $82,356 | $69,097 |
| Range | $59,436 | $39,800 |
| Mean | $51,542 | $45,169 |
| Median | $50,726 | $45,280 |
| Interquartile 25% (IQ1) | $43,899 | $38,744 |
| Interquartile 75% (IQ3) | $59,167 | $50,961 |
| Interquartile Range (IQR) | $15,268 | $12,217 |
| Standard Deviation (Sample) | $12,392 | $8,556 |
| Standard Deviation (Population) | $12,295 | $8,475 |
Similar Demographics by Median Earnings
Demographics Similar to Immigrants from Spain by Median Earnings
In terms of median earnings, the demographic groups most similar to Immigrants from Spain are Afghan ($51,112, a difference of 0.040%), Paraguayan ($51,068, a difference of 0.050%), Mongolian ($51,038, a difference of 0.11%), Greek ($51,164, a difference of 0.14%), and Lithuanian ($50,991, a difference of 0.20%).
| Demographics | Rating | Rank | Median Earnings |
| Immigrants | Serbia | 99.9 /100 | #60 | Exceptional $51,557 |
| Immigrants | Latvia | 99.9 /100 | #61 | Exceptional $51,555 |
| Immigrants | Romania | 99.9 /100 | #62 | Exceptional $51,337 |
| Immigrants | Bulgaria | 99.9 /100 | #63 | Exceptional $51,318 |
| New Zealanders | 99.9 /100 | #64 | Exceptional $51,246 |
| Greeks | 99.9 /100 | #65 | Exceptional $51,164 |
| Afghans | 99.9 /100 | #66 | Exceptional $51,112 |
| Immigrants | Spain | 99.9 /100 | #67 | Exceptional $51,092 |
| Paraguayans | 99.9 /100 | #68 | Exceptional $51,068 |
| Mongolians | 99.8 /100 | #69 | Exceptional $51,038 |
| Lithuanians | 99.8 /100 | #70 | Exceptional $50,991 |
| Immigrants | Ukraine | 99.8 /100 | #71 | Exceptional $50,984 |
| Immigrants | Egypt | 99.8 /100 | #72 | Exceptional $50,901 |
| Immigrants | Netherlands | 99.8 /100 | #73 | Exceptional $50,818 |
| South Africans | 99.8 /100 | #74 | Exceptional $50,752 |
Demographics Similar to Immigrants from Cabo Verde by Median Earnings
In terms of median earnings, the demographic groups most similar to Immigrants from Cabo Verde are Immigrants from West Indies ($43,989, a difference of 0.060%), Immigrants from Burma/Myanmar ($43,998, a difference of 0.080%), Nepalese ($43,860, a difference of 0.24%), Malaysian ($43,844, a difference of 0.27%), and Subsaharan African ($44,118, a difference of 0.35%).
| Demographics | Rating | Rank | Median Earnings |
| Aleuts | 4.4 /100 | #240 | Tragic $44,241 |
| Samoans | 4.2 /100 | #241 | Tragic $44,206 |
| Immigrants | Venezuela | 4.0 /100 | #242 | Tragic $44,163 |
| Sub-Saharan Africans | 3.7 /100 | #243 | Tragic $44,118 |
| Immigrants | Nonimmigrants | 3.7 /100 | #244 | Tragic $44,117 |
| Immigrants | Burma/Myanmar | 3.2 /100 | #245 | Tragic $43,998 |
| Immigrants | West Indies | 3.1 /100 | #246 | Tragic $43,989 |
| Immigrants | Cabo Verde | 3.0 /100 | #247 | Tragic $43,963 |
| Nepalese | 2.6 /100 | #248 | Tragic $43,860 |
| Malaysians | 2.6 /100 | #249 | Tragic $43,844 |
| Alaska Natives | 2.3 /100 | #250 | Tragic $43,750 |
| Tsimshian | 2.1 /100 | #251 | Tragic $43,695 |
| Hawaiians | 2.0 /100 | #252 | Tragic $43,673 |
| Somalis | 1.8 /100 | #253 | Tragic $43,567 |
| Liberians | 1.7 /100 | #254 | Tragic $43,536 |