Immigrants from Spain vs Immigrants from Portugal Wage/Income Gap
COMPARE
Immigrants from Spain
Immigrants from Portugal
Wage/Income Gap
Wage/Income Gap Comparison
Immigrants from Spain
Immigrants from Portugal
26.8%
WAGE/INCOME GAP
8.5/ 100
METRIC RATING
221st/ 347
METRIC RANK
26.7%
WAGE/INCOME GAP
9.5/ 100
METRIC RATING
216th/ 347
METRIC RANK
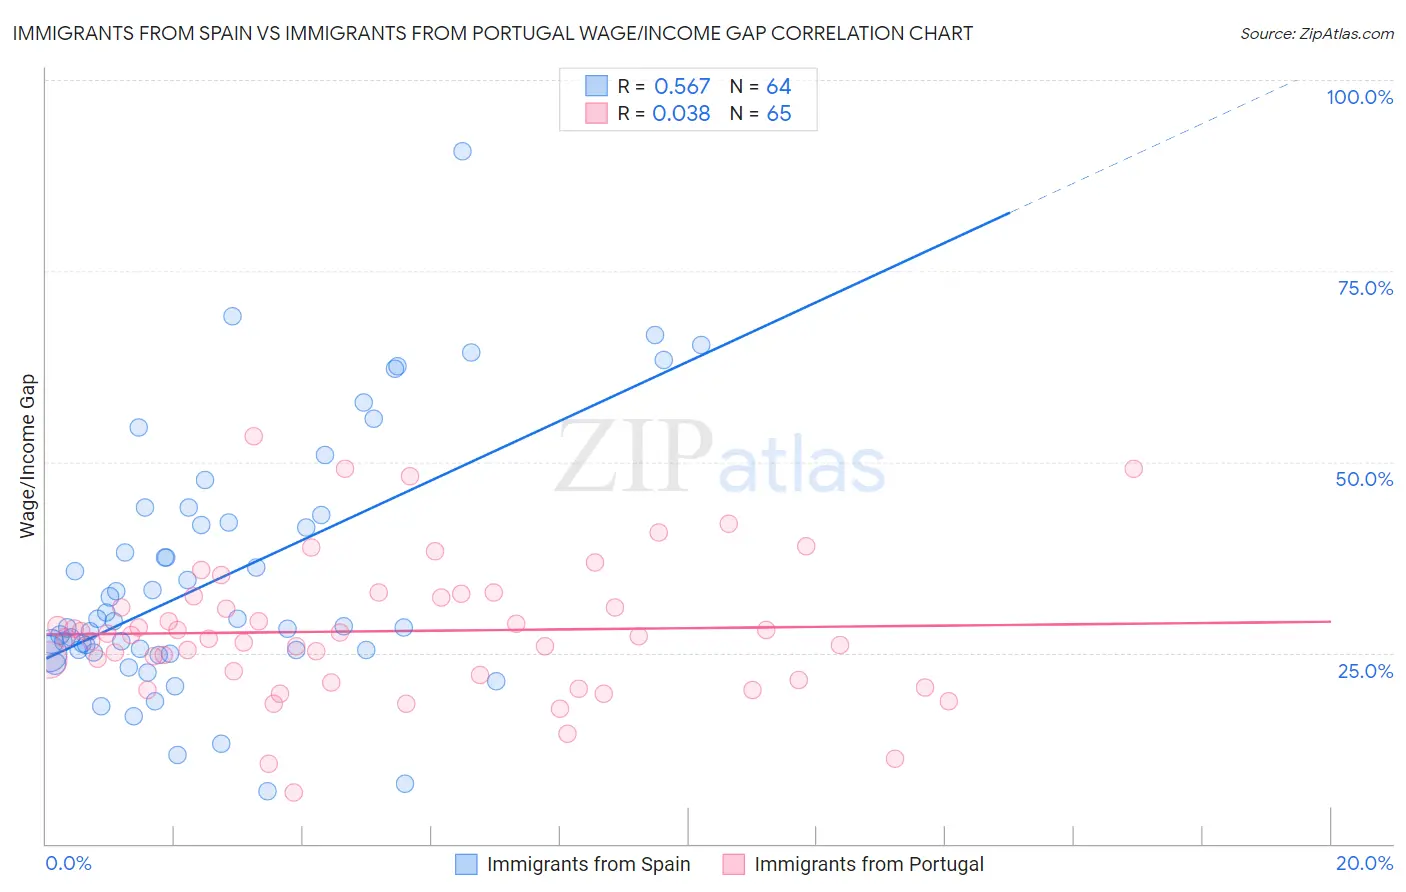
Immigrants from Spain vs Immigrants from Portugal Wage/Income Gap Correlation Chart
The statistical analysis conducted on geographies consisting of 239,614,609 people shows a substantial positive correlation between the proportion of Immigrants from Spain and wage/income gap percentage in the United States with a correlation coefficient (R) of 0.567 and weighted average of 26.8%. Similarly, the statistical analysis conducted on geographies consisting of 174,735,300 people shows no correlation between the proportion of Immigrants from Portugal and wage/income gap percentage in the United States with a correlation coefficient (R) of 0.038 and weighted average of 26.7%, a difference of 0.19%.
Wage/Income Gap Correlation Summary
| Measurement | Immigrants from Spain | Immigrants from Portugal |
| Minimum | 6.9% | 6.7% |
| Maximum | 90.7% | 53.3% |
| Range | 83.8% | 46.6% |
| Mean | 34.9% | 27.8% |
| Median | 28.8% | 27.1% |
| Interquartile 25% (IQ1) | 25.2% | 21.7% |
| Interquartile 75% (IQ3) | 42.5% | 32.3% |
| Interquartile Range (IQR) | 17.4% | 10.6% |
| Standard Deviation (Sample) | 16.6% | 9.0% |
| Standard Deviation (Population) | 16.5% | 9.0% |
Demographics Similar to Immigrants from Spain and Immigrants from Portugal by Wage/Income Gap
In terms of wage/income gap, the demographic groups most similar to Immigrants from Spain are Bolivian (26.8%, a difference of 0.040%), Immigrants from Latvia (26.7%, a difference of 0.070%), Immigrants from Poland (26.7%, a difference of 0.080%), Immigrants from Saudi Arabia (26.7%, a difference of 0.11%), and Jordanian (26.8%, a difference of 0.11%). Similarly, the demographic groups most similar to Immigrants from Portugal are Yugoslavian (26.7%, a difference of 0.040%), Brazilian (26.7%, a difference of 0.050%), Immigrants from Saudi Arabia (26.7%, a difference of 0.080%), Immigrants from Poland (26.7%, a difference of 0.11%), and Immigrants from Latvia (26.7%, a difference of 0.12%).
| Demographics | Rating | Rank | Wage/Income Gap |
| Egyptians | 12.7 /100 | #208 | Poor 26.6% |
| Immigrants | Kuwait | 12.6 /100 | #209 | Poor 26.6% |
| Arabs | 12.3 /100 | #210 | Poor 26.6% |
| Mongolians | 11.4 /100 | #211 | Poor 26.6% |
| Iraqis | 11.2 /100 | #212 | Poor 26.6% |
| Immigrants | Iraq | 10.3 /100 | #213 | Poor 26.7% |
| Immigrants | China | 10.3 /100 | #214 | Poor 26.7% |
| Yugoslavians | 9.7 /100 | #215 | Tragic 26.7% |
| Immigrants | Portugal | 9.5 /100 | #216 | Tragic 26.7% |
| Brazilians | 9.2 /100 | #217 | Tragic 26.7% |
| Immigrants | Saudi Arabia | 9.1 /100 | #218 | Tragic 26.7% |
| Immigrants | Poland | 8.9 /100 | #219 | Tragic 26.7% |
| Immigrants | Latvia | 8.9 /100 | #220 | Tragic 26.7% |
| Immigrants | Spain | 8.5 /100 | #221 | Tragic 26.8% |
| Bolivians | 8.3 /100 | #222 | Tragic 26.8% |
| Jordanians | 8.0 /100 | #223 | Tragic 26.8% |
| Immigrants | Argentina | 7.2 /100 | #224 | Tragic 26.8% |
| Immigrants | Ireland | 6.5 /100 | #225 | Tragic 26.9% |
| Asians | 5.9 /100 | #226 | Tragic 26.9% |
| Spaniards | 5.6 /100 | #227 | Tragic 27.0% |
| Immigrants | Turkey | 5.6 /100 | #228 | Tragic 27.0% |