Immigrants from Norway vs Immigrants from Cambodia Seniors Poverty Over the Age of 65
COMPARE
Immigrants from Norway
Immigrants from Cambodia
Seniors Poverty Over the Age of 65
Seniors Poverty Over the Age of 65 Comparison
Immigrants from Norway
Immigrants from Cambodia
10.5%
SENIORS POVERTY OVER THE AGE OF 65
86.5/ 100
METRIC RATING
135th/ 347
METRIC RANK
12.4%
SENIORS POVERTY OVER THE AGE OF 65
0.3/ 100
METRIC RATING
254th/ 347
METRIC RANK
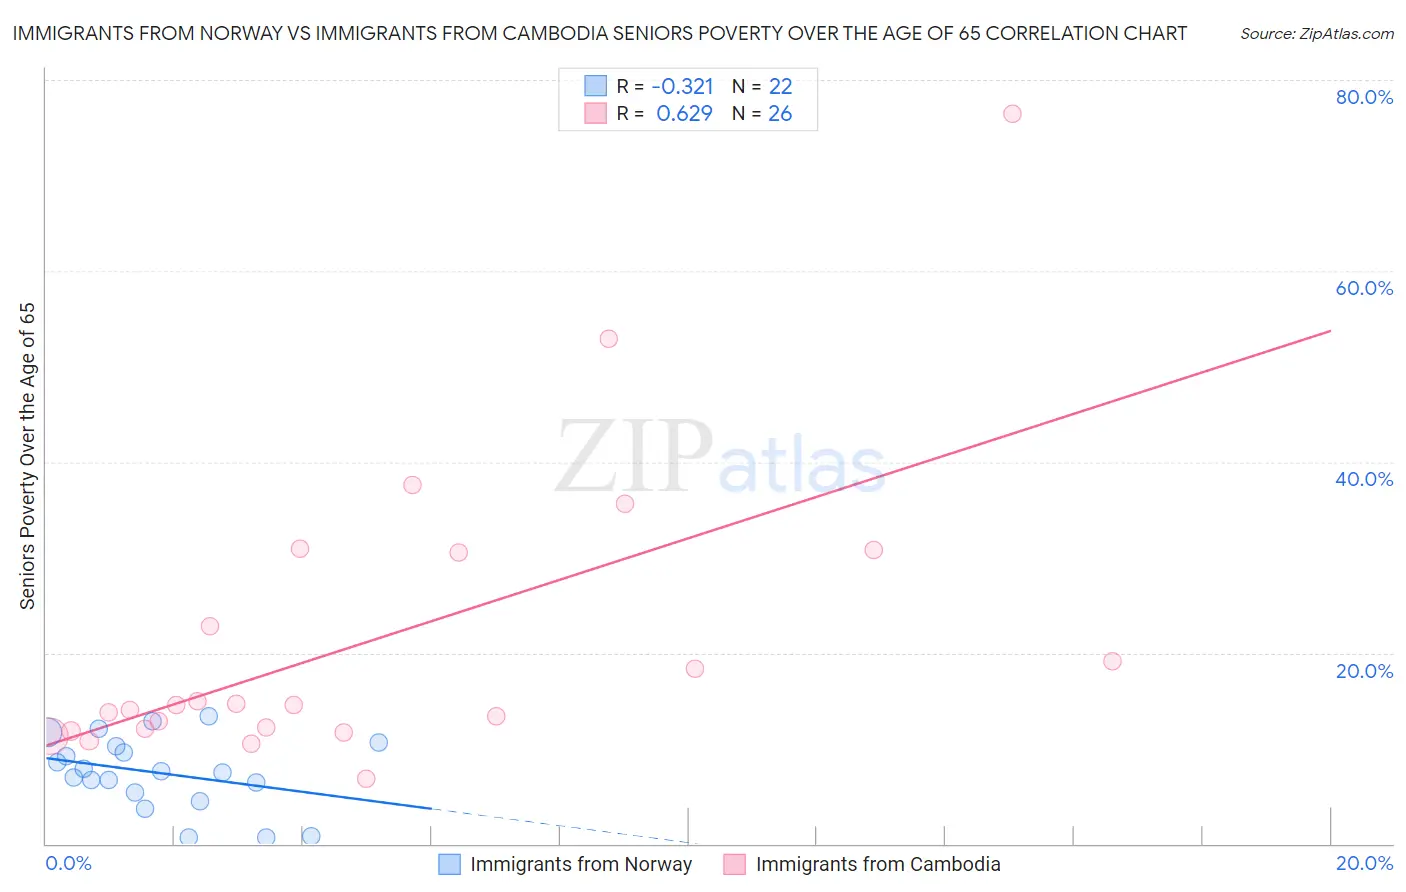
Immigrants from Norway vs Immigrants from Cambodia Seniors Poverty Over the Age of 65 Correlation Chart
The statistical analysis conducted on geographies consisting of 116,590,861 people shows a mild negative correlation between the proportion of Immigrants from Norway and poverty level among seniors over the age of 65 in the United States with a correlation coefficient (R) of -0.321 and weighted average of 10.5%. Similarly, the statistical analysis conducted on geographies consisting of 204,964,424 people shows a significant positive correlation between the proportion of Immigrants from Cambodia and poverty level among seniors over the age of 65 in the United States with a correlation coefficient (R) of 0.629 and weighted average of 12.4%, a difference of 17.9%.
Seniors Poverty Over the Age of 65 Correlation Summary
| Measurement | Immigrants from Norway | Immigrants from Cambodia |
| Minimum | 0.71% | 6.8% |
| Maximum | 13.4% | 76.5% |
| Range | 12.7% | 69.6% |
| Mean | 7.4% | 21.3% |
| Median | 7.5% | 14.6% |
| Interquartile 25% (IQ1) | 5.4% | 12.0% |
| Interquartile 75% (IQ3) | 10.2% | 30.5% |
| Interquartile Range (IQR) | 4.9% | 18.5% |
| Standard Deviation (Sample) | 3.8% | 15.6% |
| Standard Deviation (Population) | 3.7% | 15.3% |
Similar Demographics by Seniors Poverty Over the Age of 65
Demographics Similar to Immigrants from Norway by Seniors Poverty Over the Age of 65
In terms of seniors poverty over the age of 65, the demographic groups most similar to Immigrants from Norway are Immigrants from Serbia (10.5%, a difference of 0.010%), Sierra Leonean (10.5%, a difference of 0.060%), Guamanian/Chamorro (10.5%, a difference of 0.22%), Immigrants from Turkey (10.5%, a difference of 0.25%), and Egyptian (10.5%, a difference of 0.27%).
| Demographics | Rating | Rank | Seniors Poverty Over the Age of 65 |
| Ottawa | 88.5 /100 | #128 | Excellent 10.4% |
| Immigrants | Iran | 88.4 /100 | #129 | Excellent 10.4% |
| Immigrants | Oceania | 88.4 /100 | #130 | Excellent 10.4% |
| Egyptians | 87.8 /100 | #131 | Excellent 10.5% |
| Immigrants | Turkey | 87.7 /100 | #132 | Excellent 10.5% |
| Guamanians/Chamorros | 87.5 /100 | #133 | Excellent 10.5% |
| Sierra Leoneans | 86.8 /100 | #134 | Excellent 10.5% |
| Immigrants | Norway | 86.5 /100 | #135 | Excellent 10.5% |
| Immigrants | Serbia | 86.4 /100 | #136 | Excellent 10.5% |
| Immigrants | Australia | 85.1 /100 | #137 | Excellent 10.5% |
| Immigrants | Latvia | 84.7 /100 | #138 | Excellent 10.5% |
| Portuguese | 84.1 /100 | #139 | Excellent 10.5% |
| Immigrants | Kenya | 83.4 /100 | #140 | Excellent 10.5% |
| Immigrants | Europe | 83.3 /100 | #141 | Excellent 10.5% |
| Osage | 82.8 /100 | #142 | Excellent 10.6% |
Demographics Similar to Immigrants from Cambodia by Seniors Poverty Over the Age of 65
In terms of seniors poverty over the age of 65, the demographic groups most similar to Immigrants from Cambodia are Mexican American Indian (12.4%, a difference of 0.13%), Shoshone (12.3%, a difference of 0.22%), Armenian (12.3%, a difference of 0.35%), Immigrants from Panama (12.4%, a difference of 0.36%), and Immigrants (12.4%, a difference of 0.37%).
| Demographics | Rating | Rank | Seniors Poverty Over the Age of 65 |
| Japanese | 0.6 /100 | #247 | Tragic 12.2% |
| Spanish Americans | 0.6 /100 | #248 | Tragic 12.2% |
| Ute | 0.6 /100 | #249 | Tragic 12.2% |
| Immigrants | Liberia | 0.5 /100 | #250 | Tragic 12.2% |
| Somalis | 0.3 /100 | #251 | Tragic 12.3% |
| Armenians | 0.3 /100 | #252 | Tragic 12.3% |
| Shoshone | 0.3 /100 | #253 | Tragic 12.3% |
| Immigrants | Cambodia | 0.3 /100 | #254 | Tragic 12.4% |
| Mexican American Indians | 0.3 /100 | #255 | Tragic 12.4% |
| Immigrants | Panama | 0.2 /100 | #256 | Tragic 12.4% |
| Immigrants | Immigrants | 0.2 /100 | #257 | Tragic 12.4% |
| Dutch West Indians | 0.2 /100 | #258 | Tragic 12.4% |
| Ghanaians | 0.2 /100 | #259 | Tragic 12.4% |
| South Americans | 0.2 /100 | #260 | Tragic 12.5% |
| Colombians | 0.2 /100 | #261 | Tragic 12.5% |