French vs Cuban Wage/Income Gap
COMPARE
French
Cuban
Wage/Income Gap
Wage/Income Gap Comparison
French
Cubans
28.7%
WAGE/INCOME GAP
0.1/ 100
METRIC RATING
313th/ 347
METRIC RANK
23.3%
WAGE/INCOME GAP
99.7/ 100
METRIC RATING
84th/ 347
METRIC RANK
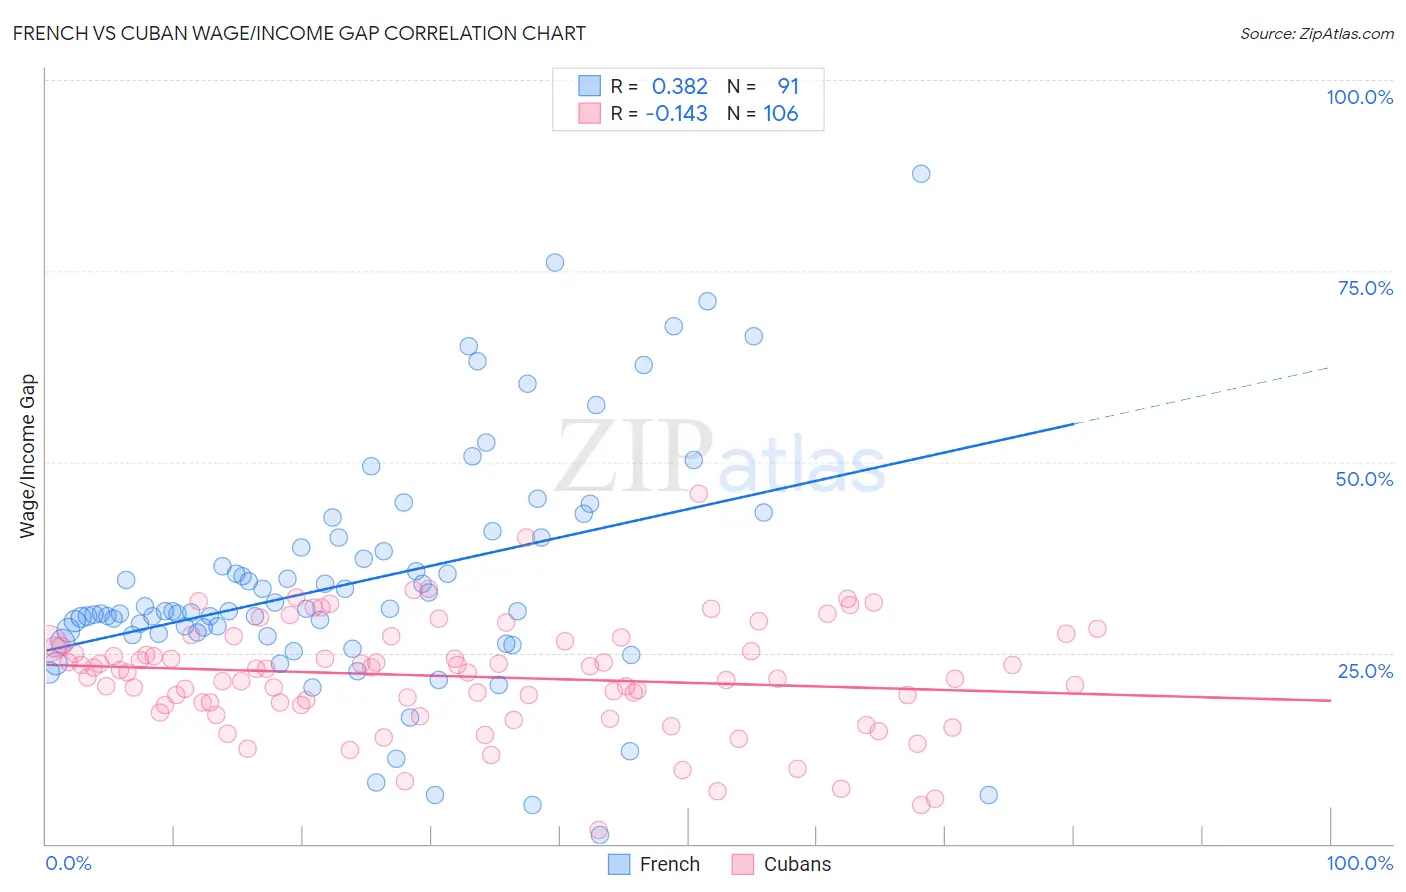
French vs Cuban Wage/Income Gap Correlation Chart
The statistical analysis conducted on geographies consisting of 569,574,307 people shows a mild positive correlation between the proportion of French and wage/income gap percentage in the United States with a correlation coefficient (R) of 0.382 and weighted average of 28.7%. Similarly, the statistical analysis conducted on geographies consisting of 448,898,454 people shows a poor negative correlation between the proportion of Cubans and wage/income gap percentage in the United States with a correlation coefficient (R) of -0.143 and weighted average of 23.3%, a difference of 23.3%.
Wage/Income Gap Correlation Summary
| Measurement | French | Cuban |
| Minimum | 1.1% | 1.9% |
| Maximum | 87.7% | 45.8% |
| Range | 86.6% | 43.9% |
| Mean | 34.3% | 21.9% |
| Median | 30.5% | 22.6% |
| Interquartile 25% (IQ1) | 27.4% | 18.2% |
| Interquartile 75% (IQ3) | 40.1% | 26.2% |
| Interquartile Range (IQR) | 12.7% | 8.0% |
| Standard Deviation (Sample) | 15.5% | 7.3% |
| Standard Deviation (Population) | 15.4% | 7.3% |
Similar Demographics by Wage/Income Gap
Demographics Similar to French by Wage/Income Gap
In terms of wage/income gap, the demographic groups most similar to French are Eastern European (28.6%, a difference of 0.13%), Immigrants from Scotland (28.7%, a difference of 0.15%), Maltese (28.7%, a difference of 0.19%), Lithuanian (28.7%, a difference of 0.20%), and Immigrants from Lithuania (28.6%, a difference of 0.26%).
| Demographics | Rating | Rank | Wage/Income Gap |
| Whites/Caucasians | 0.1 /100 | #306 | Tragic 28.5% |
| Immigrants | Denmark | 0.1 /100 | #307 | Tragic 28.5% |
| Poles | 0.1 /100 | #308 | Tragic 28.5% |
| Macedonians | 0.1 /100 | #309 | Tragic 28.6% |
| Finns | 0.1 /100 | #310 | Tragic 28.6% |
| Immigrants | Lithuania | 0.1 /100 | #311 | Tragic 28.6% |
| Eastern Europeans | 0.1 /100 | #312 | Tragic 28.6% |
| French | 0.1 /100 | #313 | Tragic 28.7% |
| Immigrants | Scotland | 0.1 /100 | #314 | Tragic 28.7% |
| Maltese | 0.1 /100 | #315 | Tragic 28.7% |
| Lithuanians | 0.1 /100 | #316 | Tragic 28.7% |
| Belgians | 0.1 /100 | #317 | Tragic 28.8% |
| Basques | 0.1 /100 | #318 | Tragic 28.8% |
| Slovaks | 0.1 /100 | #319 | Tragic 28.9% |
| British | 0.1 /100 | #320 | Tragic 28.9% |
Demographics Similar to Cubans by Wage/Income Gap
In terms of wage/income gap, the demographic groups most similar to Cubans are Immigrants from Cambodia (23.3%, a difference of 0.050%), Cheyenne (23.3%, a difference of 0.26%), Yuman (23.3%, a difference of 0.31%), Immigrants from Africa (23.2%, a difference of 0.37%), and Immigrants from Panama (23.4%, a difference of 0.63%).
| Demographics | Rating | Rank | Wage/Income Gap |
| Africans | 99.9 /100 | #77 | Exceptional 22.9% |
| Nigerians | 99.9 /100 | #78 | Exceptional 23.0% |
| Immigrants | Nicaragua | 99.9 /100 | #79 | Exceptional 23.0% |
| Salvadorans | 99.9 /100 | #80 | Exceptional 23.0% |
| Bermudans | 99.8 /100 | #81 | Exceptional 23.1% |
| Central Americans | 99.8 /100 | #82 | Exceptional 23.1% |
| Immigrants | Africa | 99.8 /100 | #83 | Exceptional 23.2% |
| Cubans | 99.7 /100 | #84 | Exceptional 23.3% |
| Immigrants | Cambodia | 99.7 /100 | #85 | Exceptional 23.3% |
| Cheyenne | 99.7 /100 | #86 | Exceptional 23.3% |
| Yuman | 99.7 /100 | #87 | Exceptional 23.3% |
| Immigrants | Panama | 99.6 /100 | #88 | Exceptional 23.4% |
| Marshallese | 99.6 /100 | #89 | Exceptional 23.4% |
| Nicaraguans | 99.6 /100 | #90 | Exceptional 23.4% |
| Arapaho | 99.6 /100 | #91 | Exceptional 23.5% |