Immigrants from Middle Africa vs Ukrainian In Labor Force | Age 45-54
COMPARE
Immigrants from Middle Africa
Ukrainian
In Labor Force | Age 45-54
In Labor Force | Age 45-54 Comparison
Immigrants from Middle Africa
Ukrainians
83.3%
IN LABOR FORCE | AGE 45-54
94.3/ 100
METRIC RATING
99th/ 347
METRIC RANK
83.2%
IN LABOR FORCE | AGE 45-54
92.7/ 100
METRIC RATING
109th/ 347
METRIC RANK
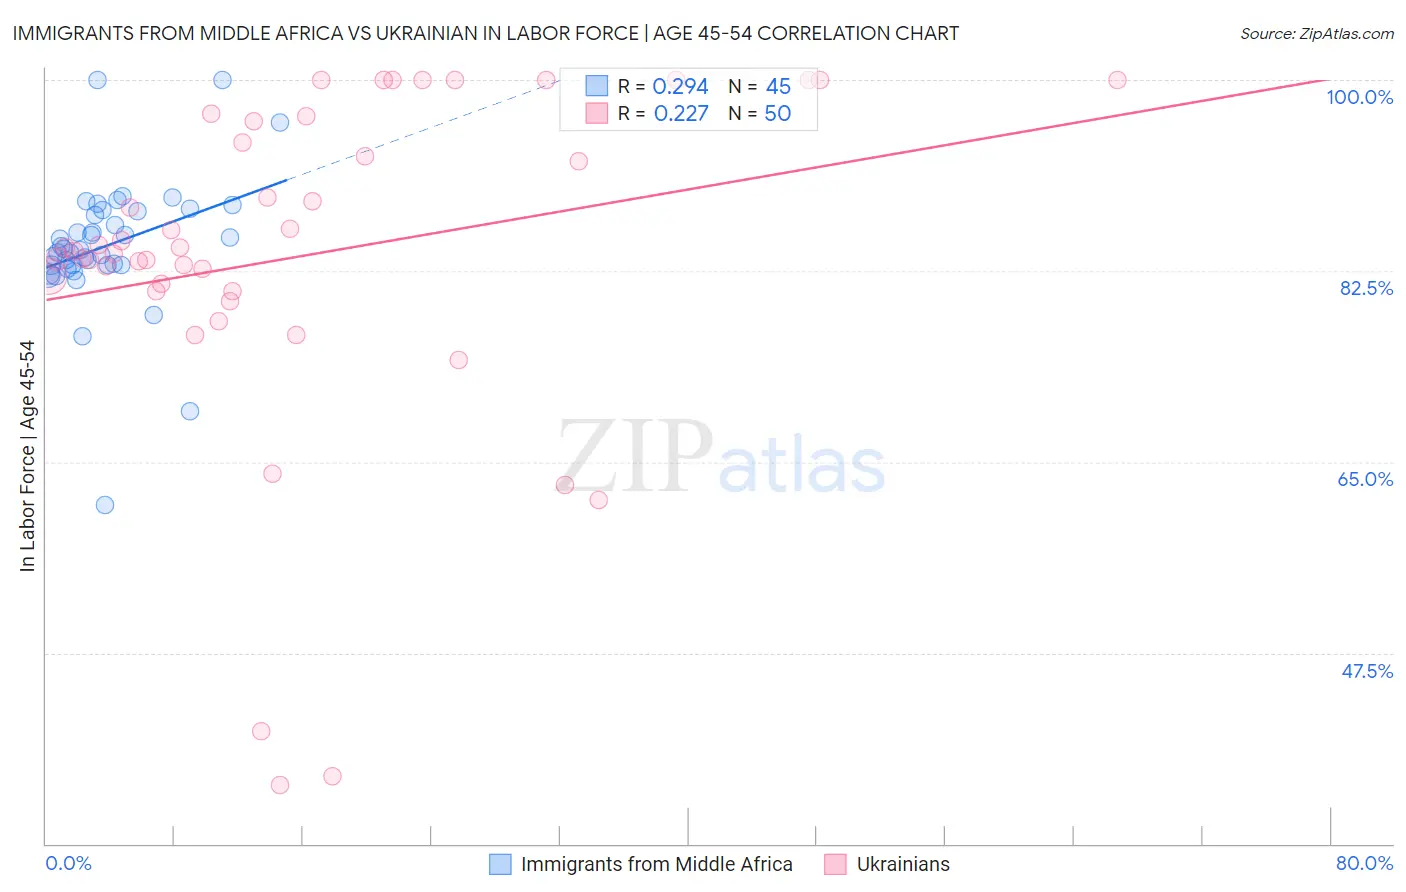
Immigrants from Middle Africa vs Ukrainian In Labor Force | Age 45-54 Correlation Chart
The statistical analysis conducted on geographies consisting of 202,639,342 people shows a weak positive correlation between the proportion of Immigrants from Middle Africa and labor force participation rate among population between the ages 45 and 54 in the United States with a correlation coefficient (R) of 0.294 and weighted average of 83.3%. Similarly, the statistical analysis conducted on geographies consisting of 448,292,186 people shows a weak positive correlation between the proportion of Ukrainians and labor force participation rate among population between the ages 45 and 54 in the United States with a correlation coefficient (R) of 0.227 and weighted average of 83.2%, a difference of 0.060%.
In Labor Force | Age 45-54 Correlation Summary
| Measurement | Immigrants from Middle Africa | Ukrainian |
| Minimum | 61.1% | 35.3% |
| Maximum | 100.0% | 100.0% |
| Range | 38.9% | 64.7% |
| Mean | 84.8% | 83.9% |
| Median | 84.4% | 84.5% |
| Interquartile 25% (IQ1) | 83.0% | 80.7% |
| Interquartile 75% (IQ3) | 88.0% | 96.2% |
| Interquartile Range (IQR) | 5.0% | 15.5% |
| Standard Deviation (Sample) | 6.2% | 15.4% |
| Standard Deviation (Population) | 6.2% | 15.2% |
Demographics Similar to Immigrants from Middle Africa and Ukrainians by In Labor Force | Age 45-54
In terms of in labor force | age 45-54, the demographic groups most similar to Immigrants from Middle Africa are Mongolian (83.3%, a difference of 0.0%), Maltese (83.3%, a difference of 0.010%), Immigrants from Belarus (83.3%, a difference of 0.010%), Immigrants from Singapore (83.3%, a difference of 0.010%), and Albanian (83.3%, a difference of 0.010%). Similarly, the demographic groups most similar to Ukrainians are Slovak (83.2%, a difference of 0.0%), Immigrants from Africa (83.2%, a difference of 0.0%), Iranian (83.2%, a difference of 0.010%), Immigrants from Italy (83.2%, a difference of 0.010%), and Immigrants from Afghanistan (83.2%, a difference of 0.010%).
| Demographics | Rating | Rank | In Labor Force | Age 45-54 |
| Argentineans | 94.9 /100 | #94 | Exceptional 83.3% |
| Immigrants | Argentina | 94.9 /100 | #95 | Exceptional 83.3% |
| Immigrants | Kuwait | 94.8 /100 | #96 | Exceptional 83.3% |
| Palestinians | 94.8 /100 | #97 | Exceptional 83.3% |
| Maltese | 94.4 /100 | #98 | Exceptional 83.3% |
| Immigrants | Middle Africa | 94.3 /100 | #99 | Exceptional 83.3% |
| Mongolians | 94.2 /100 | #100 | Exceptional 83.3% |
| Immigrants | Belarus | 94.1 /100 | #101 | Exceptional 83.3% |
| Immigrants | Singapore | 93.9 /100 | #102 | Exceptional 83.3% |
| Albanians | 93.9 /100 | #103 | Exceptional 83.3% |
| Immigrants | Romania | 93.8 /100 | #104 | Exceptional 83.3% |
| Immigrants | South America | 93.5 /100 | #105 | Exceptional 83.2% |
| Sri Lankans | 93.2 /100 | #106 | Exceptional 83.2% |
| Iranians | 92.9 /100 | #107 | Exceptional 83.2% |
| Slovaks | 92.8 /100 | #108 | Exceptional 83.2% |
| Ukrainians | 92.7 /100 | #109 | Exceptional 83.2% |
| Immigrants | Africa | 92.6 /100 | #110 | Exceptional 83.2% |
| Immigrants | Italy | 92.5 /100 | #111 | Exceptional 83.2% |
| Immigrants | Afghanistan | 92.4 /100 | #112 | Exceptional 83.2% |
| Immigrants | Albania | 91.8 /100 | #113 | Exceptional 83.2% |
| Assyrians/Chaldeans/Syriacs | 91.7 /100 | #114 | Exceptional 83.2% |