Immigrants from Jordan vs Afghan Wage/Income Gap
COMPARE
Immigrants from Jordan
Afghan
Wage/Income Gap
Wage/Income Gap Comparison
Immigrants from Jordan
Afghans
26.3%
WAGE/INCOME GAP
22.4/ 100
METRIC RATING
193rd/ 347
METRIC RANK
24.9%
WAGE/INCOME GAP
88.1/ 100
METRIC RATING
142nd/ 347
METRIC RANK
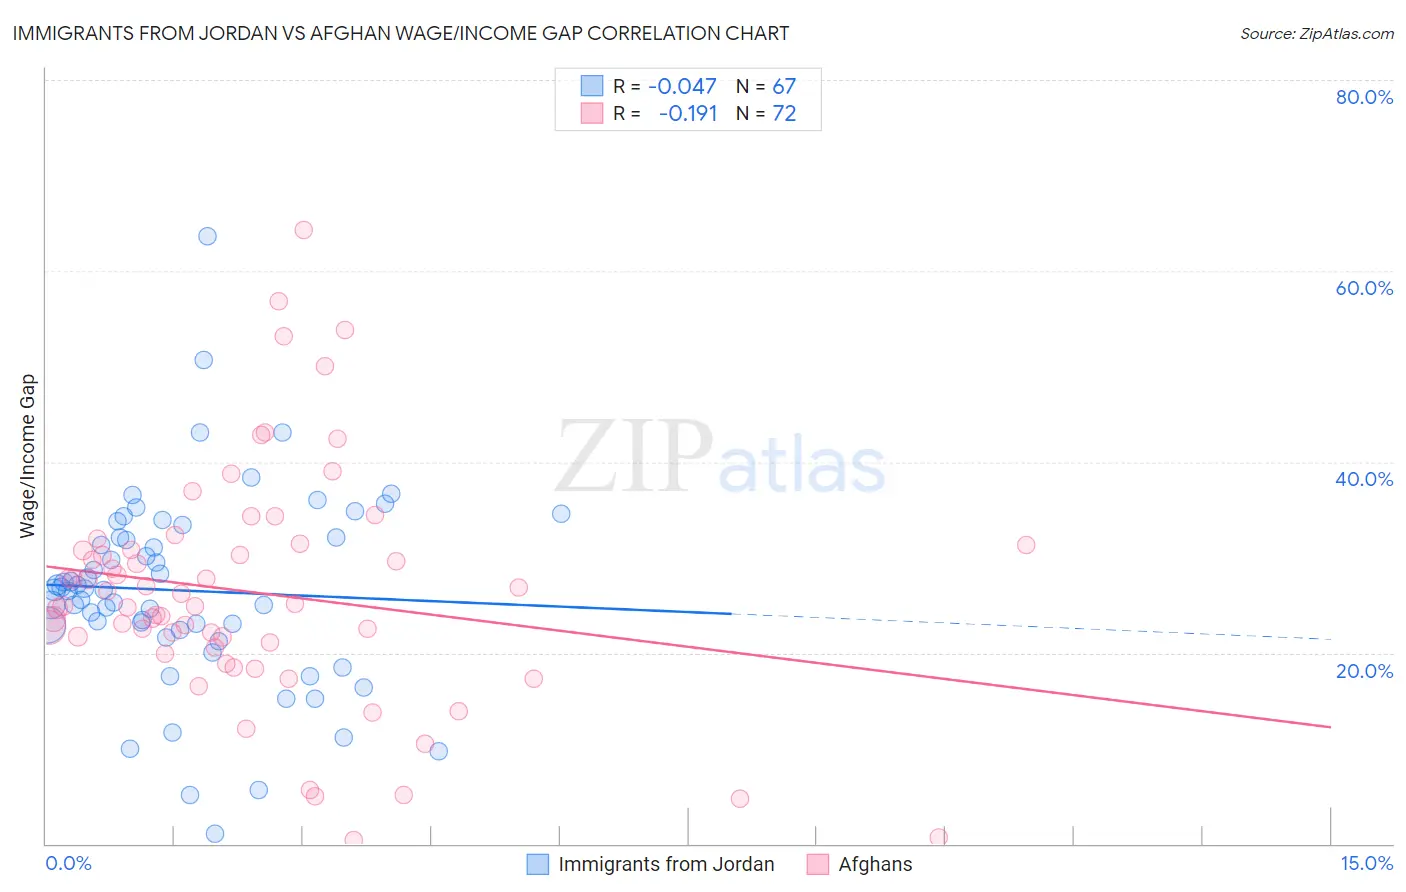
Immigrants from Jordan vs Afghan Wage/Income Gap Correlation Chart
The statistical analysis conducted on geographies consisting of 181,259,596 people shows no correlation between the proportion of Immigrants from Jordan and wage/income gap percentage in the United States with a correlation coefficient (R) of -0.047 and weighted average of 26.3%. Similarly, the statistical analysis conducted on geographies consisting of 148,863,238 people shows a poor negative correlation between the proportion of Afghans and wage/income gap percentage in the United States with a correlation coefficient (R) of -0.191 and weighted average of 24.9%, a difference of 5.5%.
Wage/Income Gap Correlation Summary
| Measurement | Immigrants from Jordan | Afghan |
| Minimum | 1.1% | 0.35% |
| Maximum | 63.6% | 64.3% |
| Range | 62.5% | 63.9% |
| Mean | 26.5% | 26.3% |
| Median | 26.6% | 25.0% |
| Interquartile 25% (IQ1) | 22.3% | 20.8% |
| Interquartile 75% (IQ3) | 32.1% | 31.1% |
| Interquartile Range (IQR) | 9.7% | 10.3% |
| Standard Deviation (Sample) | 10.3% | 12.3% |
| Standard Deviation (Population) | 10.2% | 12.2% |
Similar Demographics by Wage/Income Gap
Demographics Similar to Immigrants from Jordan by Wage/Income Gap
In terms of wage/income gap, the demographic groups most similar to Immigrants from Jordan are Chilean (26.3%, a difference of 0.0%), Immigrants from Bulgaria (26.3%, a difference of 0.020%), Immigrants from Malaysia (26.3%, a difference of 0.020%), Immigrants from Western Asia (26.3%, a difference of 0.060%), and Zimbabwean (26.3%, a difference of 0.070%).
| Demographics | Rating | Rank | Wage/Income Gap |
| Immigrants | Indonesia | 32.5 /100 | #186 | Fair 26.1% |
| Palestinians | 29.9 /100 | #187 | Fair 26.1% |
| Immigrants | Egypt | 29.9 /100 | #188 | Fair 26.1% |
| Immigrants | Moldova | 26.6 /100 | #189 | Fair 26.2% |
| Immigrants | Croatia | 24.8 /100 | #190 | Fair 26.2% |
| Immigrants | Venezuela | 24.7 /100 | #191 | Fair 26.2% |
| Immigrants | Bulgaria | 22.5 /100 | #192 | Fair 26.3% |
| Immigrants | Jordan | 22.4 /100 | #193 | Fair 26.3% |
| Chileans | 22.3 /100 | #194 | Fair 26.3% |
| Immigrants | Malaysia | 22.2 /100 | #195 | Fair 26.3% |
| Immigrants | Western Asia | 21.7 /100 | #196 | Fair 26.3% |
| Zimbabweans | 21.6 /100 | #197 | Fair 26.3% |
| Venezuelans | 21.5 /100 | #198 | Fair 26.3% |
| Dutch West Indians | 21.0 /100 | #199 | Fair 26.3% |
| Delaware | 20.9 /100 | #200 | Fair 26.3% |
Demographics Similar to Afghans by Wage/Income Gap
In terms of wage/income gap, the demographic groups most similar to Afghans are Immigrants from Uganda (24.9%, a difference of 0.020%), Chippewa (25.0%, a difference of 0.19%), Hawaiian (24.9%, a difference of 0.20%), Immigrants from Nepal (24.9%, a difference of 0.21%), and Hispanic or Latino (24.9%, a difference of 0.24%).
| Demographics | Rating | Rank | Wage/Income Gap |
| South American Indians | 92.0 /100 | #135 | Exceptional 24.7% |
| Armenians | 91.3 /100 | #136 | Exceptional 24.8% |
| Immigrants | South Eastern Asia | 90.9 /100 | #137 | Exceptional 24.8% |
| Immigrants | Bosnia and Herzegovina | 90.1 /100 | #138 | Exceptional 24.8% |
| Hispanics or Latinos | 89.5 /100 | #139 | Excellent 24.9% |
| Immigrants | Nepal | 89.3 /100 | #140 | Excellent 24.9% |
| Hawaiians | 89.3 /100 | #141 | Excellent 24.9% |
| Afghans | 88.1 /100 | #142 | Excellent 24.9% |
| Immigrants | Uganda | 88.0 /100 | #143 | Excellent 24.9% |
| Chippewa | 86.9 /100 | #144 | Excellent 25.0% |
| Comanche | 85.2 /100 | #145 | Excellent 25.0% |
| South Americans | 85.2 /100 | #146 | Excellent 25.0% |
| Malaysians | 84.9 /100 | #147 | Excellent 25.0% |
| Iroquois | 83.9 /100 | #148 | Excellent 25.1% |
| Immigrants | Peru | 82.6 /100 | #149 | Excellent 25.1% |