Immigrants from Jordan vs Chickasaw Wage/Income Gap
COMPARE
Immigrants from Jordan
Chickasaw
Wage/Income Gap
Wage/Income Gap Comparison
Immigrants from Jordan
Chickasaw
26.3%
WAGE/INCOME GAP
22.4/ 100
METRIC RATING
193rd/ 347
METRIC RANK
27.2%
WAGE/INCOME GAP
3.5/ 100
METRIC RATING
244th/ 347
METRIC RANK
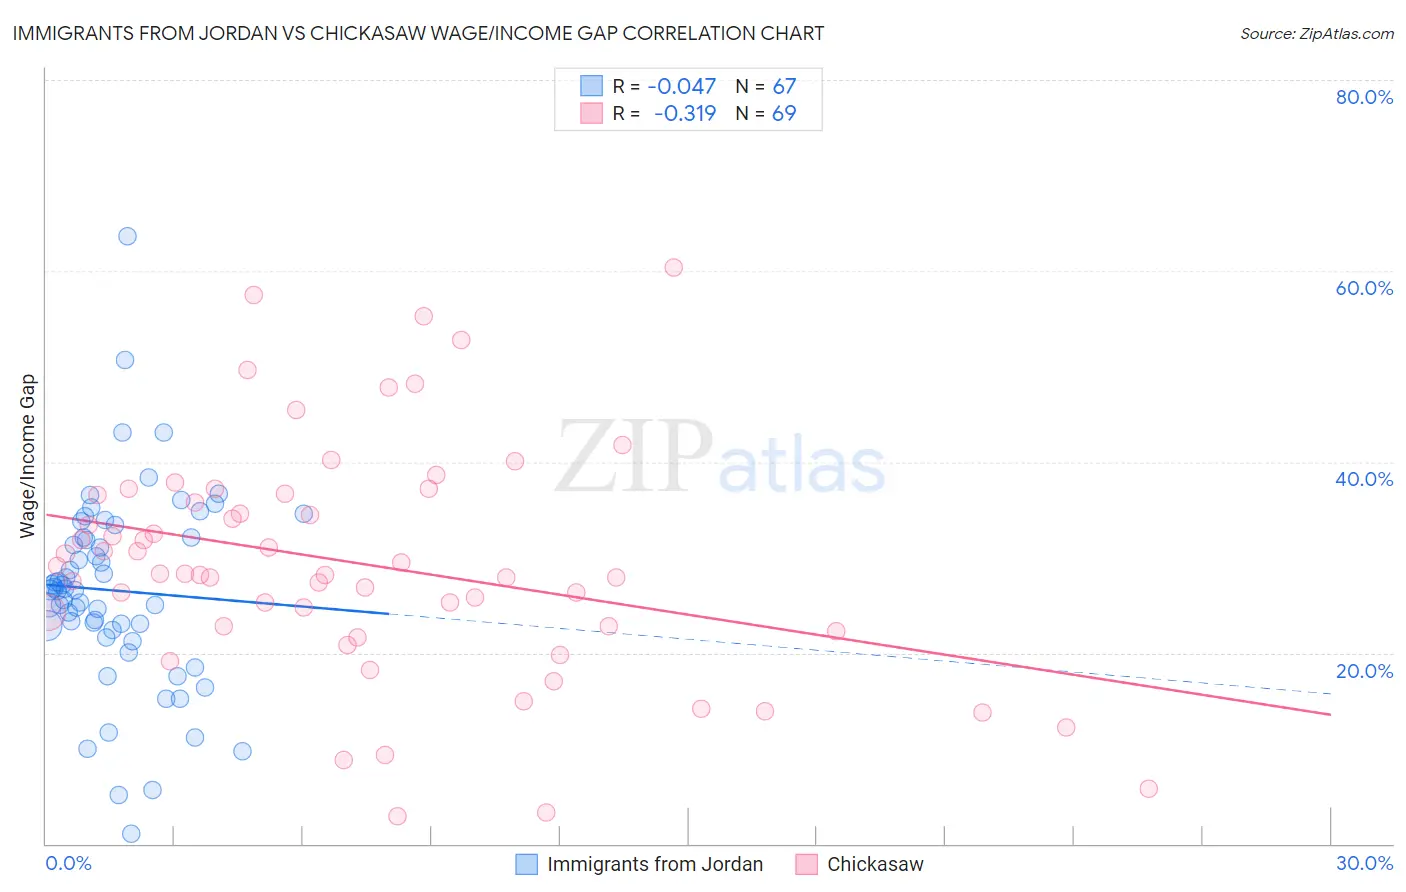
Immigrants from Jordan vs Chickasaw Wage/Income Gap Correlation Chart
The statistical analysis conducted on geographies consisting of 181,259,596 people shows no correlation between the proportion of Immigrants from Jordan and wage/income gap percentage in the United States with a correlation coefficient (R) of -0.047 and weighted average of 26.3%. Similarly, the statistical analysis conducted on geographies consisting of 147,661,645 people shows a mild negative correlation between the proportion of Chickasaw and wage/income gap percentage in the United States with a correlation coefficient (R) of -0.319 and weighted average of 27.2%, a difference of 3.3%.
Wage/Income Gap Correlation Summary
| Measurement | Immigrants from Jordan | Chickasaw |
| Minimum | 1.1% | 2.8% |
| Maximum | 63.6% | 60.4% |
| Range | 62.5% | 57.6% |
| Mean | 26.5% | 29.3% |
| Median | 26.6% | 28.3% |
| Interquartile 25% (IQ1) | 22.3% | 22.5% |
| Interquartile 75% (IQ3) | 32.1% | 36.6% |
| Interquartile Range (IQR) | 9.7% | 14.2% |
| Standard Deviation (Sample) | 10.3% | 12.2% |
| Standard Deviation (Population) | 10.2% | 12.2% |
Similar Demographics by Wage/Income Gap
Demographics Similar to Immigrants from Jordan by Wage/Income Gap
In terms of wage/income gap, the demographic groups most similar to Immigrants from Jordan are Chilean (26.3%, a difference of 0.0%), Immigrants from Bulgaria (26.3%, a difference of 0.020%), Immigrants from Malaysia (26.3%, a difference of 0.020%), Immigrants from Western Asia (26.3%, a difference of 0.060%), and Zimbabwean (26.3%, a difference of 0.070%).
| Demographics | Rating | Rank | Wage/Income Gap |
| Immigrants | Indonesia | 32.5 /100 | #186 | Fair 26.1% |
| Palestinians | 29.9 /100 | #187 | Fair 26.1% |
| Immigrants | Egypt | 29.9 /100 | #188 | Fair 26.1% |
| Immigrants | Moldova | 26.6 /100 | #189 | Fair 26.2% |
| Immigrants | Croatia | 24.8 /100 | #190 | Fair 26.2% |
| Immigrants | Venezuela | 24.7 /100 | #191 | Fair 26.2% |
| Immigrants | Bulgaria | 22.5 /100 | #192 | Fair 26.3% |
| Immigrants | Jordan | 22.4 /100 | #193 | Fair 26.3% |
| Chileans | 22.3 /100 | #194 | Fair 26.3% |
| Immigrants | Malaysia | 22.2 /100 | #195 | Fair 26.3% |
| Immigrants | Western Asia | 21.7 /100 | #196 | Fair 26.3% |
| Zimbabweans | 21.6 /100 | #197 | Fair 26.3% |
| Venezuelans | 21.5 /100 | #198 | Fair 26.3% |
| Dutch West Indians | 21.0 /100 | #199 | Fair 26.3% |
| Delaware | 20.9 /100 | #200 | Fair 26.3% |
Demographics Similar to Chickasaw by Wage/Income Gap
In terms of wage/income gap, the demographic groups most similar to Chickasaw are Immigrants from the Azores (27.2%, a difference of 0.020%), Spanish (27.1%, a difference of 0.070%), Immigrants from Sri Lanka (27.1%, a difference of 0.080%), Nonimmigrants (27.2%, a difference of 0.090%), and Creek (27.1%, a difference of 0.13%).
| Demographics | Rating | Rank | Wage/Income Gap |
| Immigrants | Eastern Asia | 4.4 /100 | #237 | Tragic 27.1% |
| Osage | 4.4 /100 | #238 | Tragic 27.1% |
| Estonians | 4.3 /100 | #239 | Tragic 27.1% |
| Immigrants | Europe | 3.8 /100 | #240 | Tragic 27.1% |
| Creek | 3.8 /100 | #241 | Tragic 27.1% |
| Immigrants | Sri Lanka | 3.7 /100 | #242 | Tragic 27.1% |
| Spanish | 3.6 /100 | #243 | Tragic 27.1% |
| Chickasaw | 3.5 /100 | #244 | Tragic 27.2% |
| Immigrants | Azores | 3.5 /100 | #245 | Tragic 27.2% |
| Immigrants | Nonimmigrants | 3.3 /100 | #246 | Tragic 27.2% |
| Celtics | 2.8 /100 | #247 | Tragic 27.3% |
| Cypriots | 2.8 /100 | #248 | Tragic 27.3% |
| Carpatho Rusyns | 2.7 /100 | #249 | Tragic 27.3% |
| Immigrants | Czechoslovakia | 2.7 /100 | #250 | Tragic 27.3% |
| Immigrants | Norway | 2.5 /100 | #251 | Tragic 27.3% |