Immigrants from Jordan vs Immigrants from Poland Wage/Income Gap

COMPARE

Immigrants from Jordan
Race
Ancestry
AfghanAfricanAlaska NativeAlaskan AthabascanAlbanianAleutAlsatianAmericanApacheArabArapahoArgentineanArmenianAssyrian/Chaldean/SyriacAustralianAustrianBahamianBangladeshiBarbadianBasqueBelgianBelizeanBermudanBhutaneseBlackfeetBolivianBrazilianBritishBritish West IndianBulgarianBurmeseCajunCambodianCanadianCape VerdeanCarpatho RusynCelticCentral AmericanCentral American IndianCherokeeCheyenneChickasawChileanChineseChippewaChoctawColombianColvilleComancheCosta RicanCreeCreekCroatianCrowCubanCypriotCzechCzechoslovakianDanishDelawareDominicanDutchDutch West IndianEastern EuropeanEcuadorianEgyptianEnglishEstonianEthiopianEuropeanFijianFilipinoFinnishFrenchFrench American IndianFrench CanadianGermanGerman RussianGhanaianGreekGuamanian/ChamorroGuatemalanGuyaneseHaitianHmongHonduranHopiHoumaHungarianIcelanderIndian (Asian)IndonesianInupiatIranianIraqiIrishIroquoisIsraeliItalianJamaicanJapaneseJordanianKenyanKiowaKoreanLaotianLatvianLebaneseLiberianLithuanianLumbeeLuxembourgerMacedonianMalaysianMalteseMarshalleseMenomineeMexicanMexican American IndianMongolianMoroccanNative HawaiianNavajoNepaleseNew ZealanderNicaraguanNigerianNorthern EuropeanNorwegianOkinawanOsageOttawaPaiutePakistaniPalestinianPanamanianParaguayanPennsylvania GermanPeruvianPimaPolishPortuguesePotawatomiPuebloPuerto RicanPuget Sound SalishRomanianRussianSalvadoranSamoanScandinavianScotch-IrishScottishSeminoleSenegaleseSerbianShoshoneSierra LeoneanSiouxSlavicSlovakSloveneSomaliSouth AfricanSouth AmericanSouth American IndianSoviet UnionSpaniardSpanishSpanish AmericanSpanish American IndianSri LankanSubsaharan AfricanSudaneseSwedishSwissSyrianTaiwaneseThaiTlingit-HaidaTohono O'OdhamTonganTrinidadian and TobagonianTsimshianTurkishU.S. Virgin IslanderUgandanUkrainianUruguayanUteVenezuelanVietnameseWelshWest IndianYakamaYaquiYugoslavianYumanYup'ikZimbabwean
Immigration
NonimmigrantsImmigrantsAfghanistanAfricaAlbaniaArgentinaArmeniaAsiaAustraliaAustriaBahamasBangladeshBarbadosBelarusBelgiumBelizeBoliviaBosnia and HerzegovinaBrazilBulgariaBurma/MyanmarCabo VerdeCambodiaCameroonCanadaCaribbeanCentral AmericaChileChinaColombiaCongoCosta RicaCroatiaCubaCzechoslovakiaDenmarkDominicaDominican RepublicEastern AfricaEastern AsiaEastern EuropeEcuadorEgyptEl SalvadorEnglandEritreaEthiopiaEuropeFijiFranceGermanyGhanaGreeceGrenadaGuatemalaGuyanaHaitiHondurasHong KongHungaryIndiaIndonesiaIranIraqIrelandIsraelItalyJamaicaJapanJordanKazakhstanKenyaKoreaKuwaitLaosLatin AmericaLatviaLebanonLiberiaLithuaniaMalaysiaMexicoMicronesiaMiddle AfricaMoldovaMoroccoNepalNetherlandsNicaraguaNigeriaNorth AmericaNorth MacedoniaNorthern AfricaNorthern EuropeNorwayOceaniaPakistanPanamaPeruPhilippinesPortugalRomaniaRussiaSaudi ArabiaScotlandSenegalSerbiaSierra LeoneSingaporeSomaliaSouth AfricaSouth AmericaSouth Central AsiaSouth Eastern AsiaSouthern EuropeSpainSri LankaSt. Vincent and the GrenadinesSudanSwedenSwitzerlandSyriaTaiwanThailandTrinidad and TobagoTurkeyUgandaUkraineUruguayUzbekistanVenezuelaVietnamWest IndiesWestern AfricaWestern AsiaWestern EuropeYemenZaireZimbabweAzores
Immigrants from Poland
Race
Ancestry
AfghanAfricanAlaska NativeAlaskan AthabascanAlbanianAleutAlsatianAmericanApacheArabArapahoArgentineanArmenianAssyrian/Chaldean/SyriacAustralianAustrianBahamianBangladeshiBarbadianBasqueBelgianBelizeanBermudanBhutaneseBlackfeetBolivianBrazilianBritishBritish West IndianBulgarianBurmeseCajunCambodianCanadianCape VerdeanCarpatho RusynCelticCentral AmericanCentral American IndianCherokeeCheyenneChickasawChileanChineseChippewaChoctawColombianColvilleComancheCosta RicanCreeCreekCroatianCrowCubanCypriotCzechCzechoslovakianDanishDelawareDominicanDutchDutch West IndianEastern EuropeanEcuadorianEgyptianEnglishEstonianEthiopianEuropeanFijianFilipinoFinnishFrenchFrench American IndianFrench CanadianGermanGerman RussianGhanaianGreekGuamanian/ChamorroGuatemalanGuyaneseHaitianHmongHonduranHopiHoumaHungarianIcelanderIndian (Asian)IndonesianInupiatIranianIraqiIrishIroquoisIsraeliItalianJamaicanJapaneseJordanianKenyanKiowaKoreanLaotianLatvianLebaneseLiberianLithuanianLumbeeLuxembourgerMacedonianMalaysianMalteseMarshalleseMenomineeMexicanMexican American IndianMongolianMoroccanNative HawaiianNavajoNepaleseNew ZealanderNicaraguanNigerianNorthern EuropeanNorwegianOkinawanOsageOttawaPaiutePakistaniPalestinianPanamanianParaguayanPennsylvania GermanPeruvianPimaPolishPortuguesePotawatomiPuebloPuerto RicanPuget Sound SalishRomanianRussianSalvadoranSamoanScandinavianScotch-IrishScottishSeminoleSenegaleseSerbianShoshoneSierra LeoneanSiouxSlavicSlovakSloveneSomaliSouth AfricanSouth AmericanSouth American IndianSoviet UnionSpaniardSpanishSpanish AmericanSpanish American IndianSri LankanSubsaharan AfricanSudaneseSwedishSwissSyrianTaiwaneseThaiTlingit-HaidaTohono O'OdhamTonganTrinidadian and TobagonianTsimshianTurkishU.S. Virgin IslanderUgandanUkrainianUruguayanUteVenezuelanVietnameseWelshWest IndianYakamaYaquiYugoslavianYumanYup'ikZimbabwean
Immigration
NonimmigrantsImmigrantsAfghanistanAfricaAlbaniaArgentinaArmeniaAsiaAustraliaAustriaBahamasBangladeshBarbadosBelarusBelgiumBelizeBoliviaBosnia and HerzegovinaBrazilBulgariaBurma/MyanmarCabo VerdeCambodiaCameroonCanadaCaribbeanCentral AmericaChileChinaColombiaCongoCosta RicaCroatiaCubaCzechoslovakiaDenmarkDominicaDominican RepublicEastern AfricaEastern AsiaEastern EuropeEcuadorEgyptEl SalvadorEnglandEritreaEthiopiaEuropeFijiFranceGermanyGhanaGreeceGrenadaGuatemalaGuyanaHaitiHondurasHong KongHungaryIndiaIndonesiaIranIraqIrelandIsraelItalyJamaicaJapanKazakhstanKenyaKoreaKuwaitLaosLatin AmericaLatviaLebanonLiberiaLithuaniaMalaysiaMexicoMicronesiaMiddle AfricaMoldovaMoroccoNepalNetherlandsNicaraguaNigeriaNorth AmericaNorth MacedoniaNorthern AfricaNorthern EuropeNorwayOceaniaPakistanPanamaPeruPhilippinesPolandPortugalRomaniaRussiaSaudi ArabiaScotlandSenegalSerbiaSierra LeoneSingaporeSomaliaSouth AfricaSouth AmericaSouth Central AsiaSouth Eastern AsiaSouthern EuropeSpainSri LankaSt. Vincent and the GrenadinesSudanSwedenSwitzerlandSyriaTaiwanThailandTrinidad and TobagoTurkeyUgandaUkraineUruguayUzbekistanVenezuelaVietnamWest IndiesWestern AfricaWestern AsiaWestern EuropeYemenZaireZimbabweAzores
Wage/Income Gap
Income
Poverty
Unemployment
Labor Participation
Family Structure
Vehicle Availability
Education Level
Disability

Wage/Income Gap Comparison

Immigrants from Jordan

Immigrants from Poland

Fair
Tragic
26.3%
WAGE/INCOME GAP
22.4/ 100
METRIC RATING
193rd/ 347
METRIC RANK
26.7%
WAGE/INCOME GAP
8.9/ 100
METRIC RATING
219th/ 347
METRIC RANK

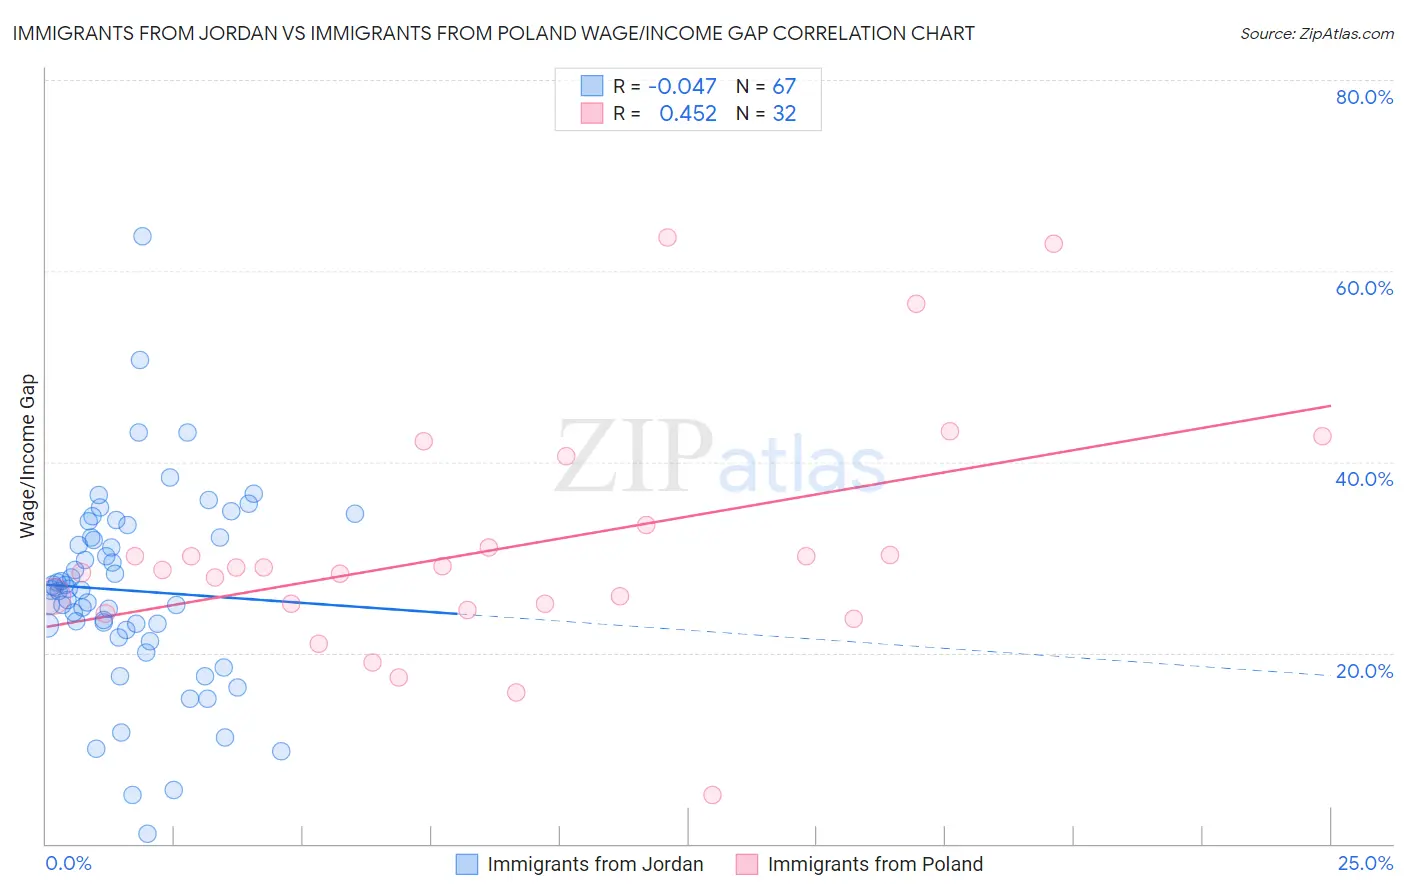
Immigrants from Jordan vs Immigrants from Poland Wage/Income Gap Correlation Chart

The statistical analysis conducted on geographies consisting of 181,259,596 people shows no correlation between the proportion of Immigrants from Jordan and wage/income gap percentage in the United States with a correlation coefficient (R) of -0.047 and weighted average of 26.3%. Similarly, the statistical analysis conducted on geographies consisting of 304,701,845 people shows a moderate positive correlation between the proportion of Immigrants from Poland and wage/income gap percentage in the United States with a correlation coefficient (R) of 0.452 and weighted average of 26.7%, a difference of 1.7%.
Immigrants from Jordan vs Immigrants from Poland Wage/Income Gap

Wage/Income Gap Correlation Summary

MeasurementImmigrants from JordanImmigrants from Poland
Minimum1.1%5.1%
Maximum63.6%63.5%
Range62.5%58.4%
Mean26.5%30.9%
Median26.6%28.8%
Interquartile 25% (IQ1)22.3%24.8%
Interquartile 75% (IQ3)32.1%32.3%
Interquartile Range (IQR)9.7%7.5%
Standard Deviation (Sample)10.3%12.5%
Standard Deviation (Population)10.2%12.3%

Similar Demographics by Wage/Income Gap

Demographics Similar to Immigrants from Jordan by Wage/Income Gap

In terms of wage/income gap, the demographic groups most similar to Immigrants from Jordan are Chilean (26.3%, a difference of 0.0%), Immigrants from Bulgaria (26.3%, a difference of 0.020%), Immigrants from Malaysia (26.3%, a difference of 0.020%), Immigrants from Western Asia (26.3%, a difference of 0.060%), and Zimbabwean (26.3%, a difference of 0.070%).
DemographicsRating | RankWage/Income Gap
Immigrants | Indonesia
32.5
/100
|
#186
Fair
26.1%
Palestinians
29.9
/100
|
#187
Fair
26.1%
Immigrants | Egypt
29.9
/100
|
#188
Fair
26.1%
Immigrants | Moldova
26.6
/100
|
#189
Fair
26.2%
Immigrants | Croatia
24.8
/100
|
#190
Fair
26.2%
Immigrants | Venezuela
24.7
/100
|
#191
Fair
26.2%
Immigrants | Bulgaria
22.5
/100
|
#192
Fair
26.3%
Immigrants | Jordan
22.4
/100
|
#193
Fair
26.3%
Chileans
22.3
/100
|
#194
Fair
26.3%
Immigrants | Malaysia
22.2
/100
|
#195
Fair
26.3%
Immigrants | Western Asia
21.7
/100
|
#196
Fair
26.3%
Zimbabweans
21.6
/100
|
#197
Fair
26.3%
Venezuelans
21.5
/100
|
#198
Fair
26.3%
Dutch West Indians
21.0
/100
|
#199
Fair
26.3%
Delaware
20.9
/100
|
#200
Fair
26.3%

Demographics Similar to Immigrants from Poland by Wage/Income Gap

In terms of wage/income gap, the demographic groups most similar to Immigrants from Poland are Immigrants from Latvia (26.7%, a difference of 0.010%), Immigrants from Saudi Arabia (26.7%, a difference of 0.030%), Brazilian (26.7%, a difference of 0.050%), Immigrants from Spain (26.8%, a difference of 0.080%), and Immigrants from Portugal (26.7%, a difference of 0.11%).
DemographicsRating | RankWage/Income Gap
Iraqis
11.2
/100
|
#212
Poor
26.6%
Immigrants | Iraq
10.3
/100
|
#213
Poor
26.7%
Immigrants | China
10.3
/100
|
#214
Poor
26.7%
Yugoslavians
9.7
/100
|
#215
Tragic
26.7%
Immigrants | Portugal
9.5
/100
|
#216
Tragic
26.7%
Brazilians
9.2
/100
|
#217
Tragic
26.7%
Immigrants | Saudi Arabia
9.1
/100
|
#218
Tragic
26.7%
Immigrants | Poland
8.9
/100
|
#219
Tragic
26.7%
Immigrants | Latvia
8.9
/100
|
#220
Tragic
26.7%
Immigrants | Spain
8.5
/100
|
#221
Tragic
26.8%
Bolivians
8.3
/100
|
#222
Tragic
26.8%
Jordanians
8.0
/100
|
#223
Tragic
26.8%
Immigrants | Argentina
7.2
/100
|
#224
Tragic
26.8%
Immigrants | Ireland
6.5
/100
|
#225
Tragic
26.9%
Asians
5.9
/100
|
#226
Tragic
26.9%