Immigrants from Iran vs Latvian Wage/Income Gap
COMPARE
Immigrants from Iran
Latvian
Wage/Income Gap
Wage/Income Gap Comparison
Immigrants from Iran
Latvians
29.1%
WAGE/INCOME GAP
0.0/ 100
METRIC RATING
327th/ 347
METRIC RANK
27.9%
WAGE/INCOME GAP
0.7/ 100
METRIC RATING
277th/ 347
METRIC RANK
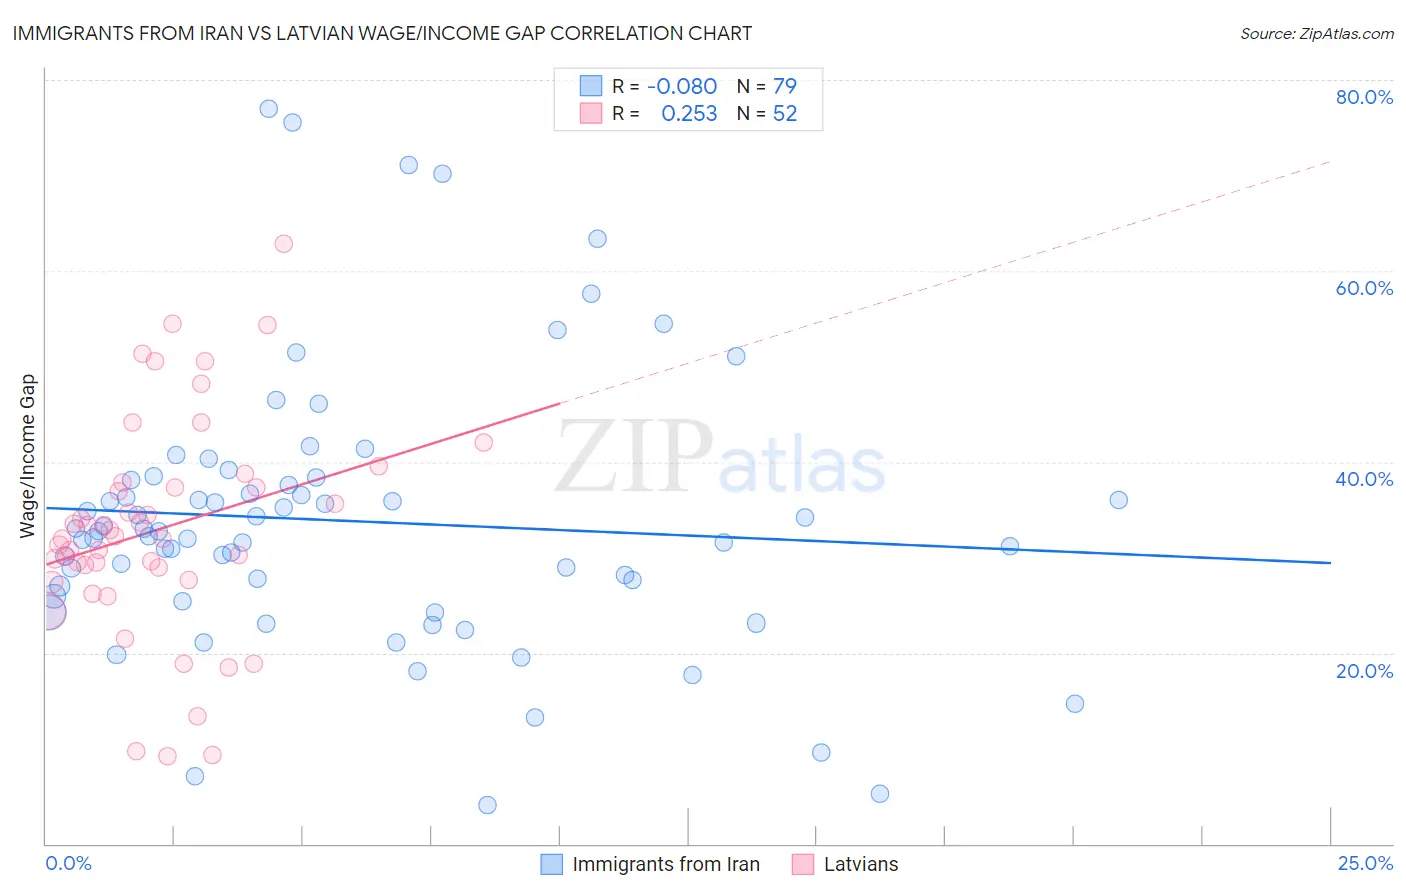
Immigrants from Iran vs Latvian Wage/Income Gap Correlation Chart
The statistical analysis conducted on geographies consisting of 279,798,376 people shows a slight negative correlation between the proportion of Immigrants from Iran and wage/income gap percentage in the United States with a correlation coefficient (R) of -0.080 and weighted average of 29.1%. Similarly, the statistical analysis conducted on geographies consisting of 220,666,647 people shows a weak positive correlation between the proportion of Latvians and wage/income gap percentage in the United States with a correlation coefficient (R) of 0.253 and weighted average of 27.9%, a difference of 4.3%.
Wage/Income Gap Correlation Summary
| Measurement | Immigrants from Iran | Latvian |
| Minimum | 4.0% | 9.2% |
| Maximum | 77.0% | 62.8% |
| Range | 73.0% | 53.6% |
| Mean | 33.8% | 32.9% |
| Median | 32.7% | 32.1% |
| Interquartile 25% (IQ1) | 25.9% | 28.3% |
| Interquartile 75% (IQ3) | 38.2% | 37.6% |
| Interquartile Range (IQR) | 12.3% | 9.3% |
| Standard Deviation (Sample) | 14.3% | 11.4% |
| Standard Deviation (Population) | 14.2% | 11.3% |
Similar Demographics by Wage/Income Gap
Demographics Similar to Immigrants from Iran by Wage/Income Gap
In terms of wage/income gap, the demographic groups most similar to Immigrants from Iran are Scandinavian (29.1%, a difference of 0.060%), Immigrants from Belgium (29.0%, a difference of 0.11%), Hungarian (29.0%, a difference of 0.18%), Scottish (29.1%, a difference of 0.20%), and German (29.2%, a difference of 0.30%).
| Demographics | Rating | Rank | Wage/Income Gap |
| British | 0.1 /100 | #320 | Tragic 28.9% |
| Welsh | 0.1 /100 | #321 | Tragic 28.9% |
| Immigrants | Singapore | 0.1 /100 | #322 | Tragic 28.9% |
| Norwegians | 0.1 /100 | #323 | Tragic 29.0% |
| Croatians | 0.0 /100 | #324 | Tragic 29.0% |
| Hungarians | 0.0 /100 | #325 | Tragic 29.0% |
| Immigrants | Belgium | 0.0 /100 | #326 | Tragic 29.0% |
| Immigrants | Iran | 0.0 /100 | #327 | Tragic 29.1% |
| Scandinavians | 0.0 /100 | #328 | Tragic 29.1% |
| Scottish | 0.0 /100 | #329 | Tragic 29.1% |
| Germans | 0.0 /100 | #330 | Tragic 29.2% |
| Czechs | 0.0 /100 | #331 | Tragic 29.2% |
| Immigrants | South Central Asia | 0.0 /100 | #332 | Tragic 29.3% |
| Europeans | 0.0 /100 | #333 | Tragic 29.4% |
| Swedes | 0.0 /100 | #334 | Tragic 29.4% |
Demographics Similar to Latvians by Wage/Income Gap
In terms of wage/income gap, the demographic groups most similar to Latvians are Lebanese (27.9%, a difference of 0.0%), Immigrants from Japan (27.9%, a difference of 0.030%), Immigrants from England (27.9%, a difference of 0.080%), American (27.8%, a difference of 0.11%), and Bulgarian (27.8%, a difference of 0.15%).
| Demographics | Rating | Rank | Wage/Income Gap |
| Immigrants | Western Europe | 0.9 /100 | #270 | Tragic 27.8% |
| Ute | 0.8 /100 | #271 | Tragic 27.8% |
| Immigrants | Korea | 0.8 /100 | #272 | Tragic 27.8% |
| Bulgarians | 0.7 /100 | #273 | Tragic 27.8% |
| Americans | 0.7 /100 | #274 | Tragic 27.8% |
| Immigrants | Japan | 0.7 /100 | #275 | Tragic 27.9% |
| Lebanese | 0.7 /100 | #276 | Tragic 27.9% |
| Latvians | 0.7 /100 | #277 | Tragic 27.9% |
| Immigrants | England | 0.6 /100 | #278 | Tragic 27.9% |
| Romanians | 0.5 /100 | #279 | Tragic 28.0% |
| Russians | 0.5 /100 | #280 | Tragic 28.0% |
| Burmese | 0.5 /100 | #281 | Tragic 28.0% |
| South Africans | 0.5 /100 | #282 | Tragic 28.0% |
| French Canadians | 0.4 /100 | #283 | Tragic 28.1% |
| Immigrants | Sweden | 0.4 /100 | #284 | Tragic 28.1% |