Yugoslavian vs Immigrants from Micronesia Wage/Income Gap
COMPARE
Yugoslavian
Immigrants from Micronesia
Wage/Income Gap
Wage/Income Gap Comparison
Yugoslavians
Immigrants from Micronesia
26.7%
WAGE/INCOME GAP
9.7/ 100
METRIC RATING
215th/ 347
METRIC RANK
24.4%
WAGE/INCOME GAP
95.8/ 100
METRIC RATING
118th/ 347
METRIC RANK
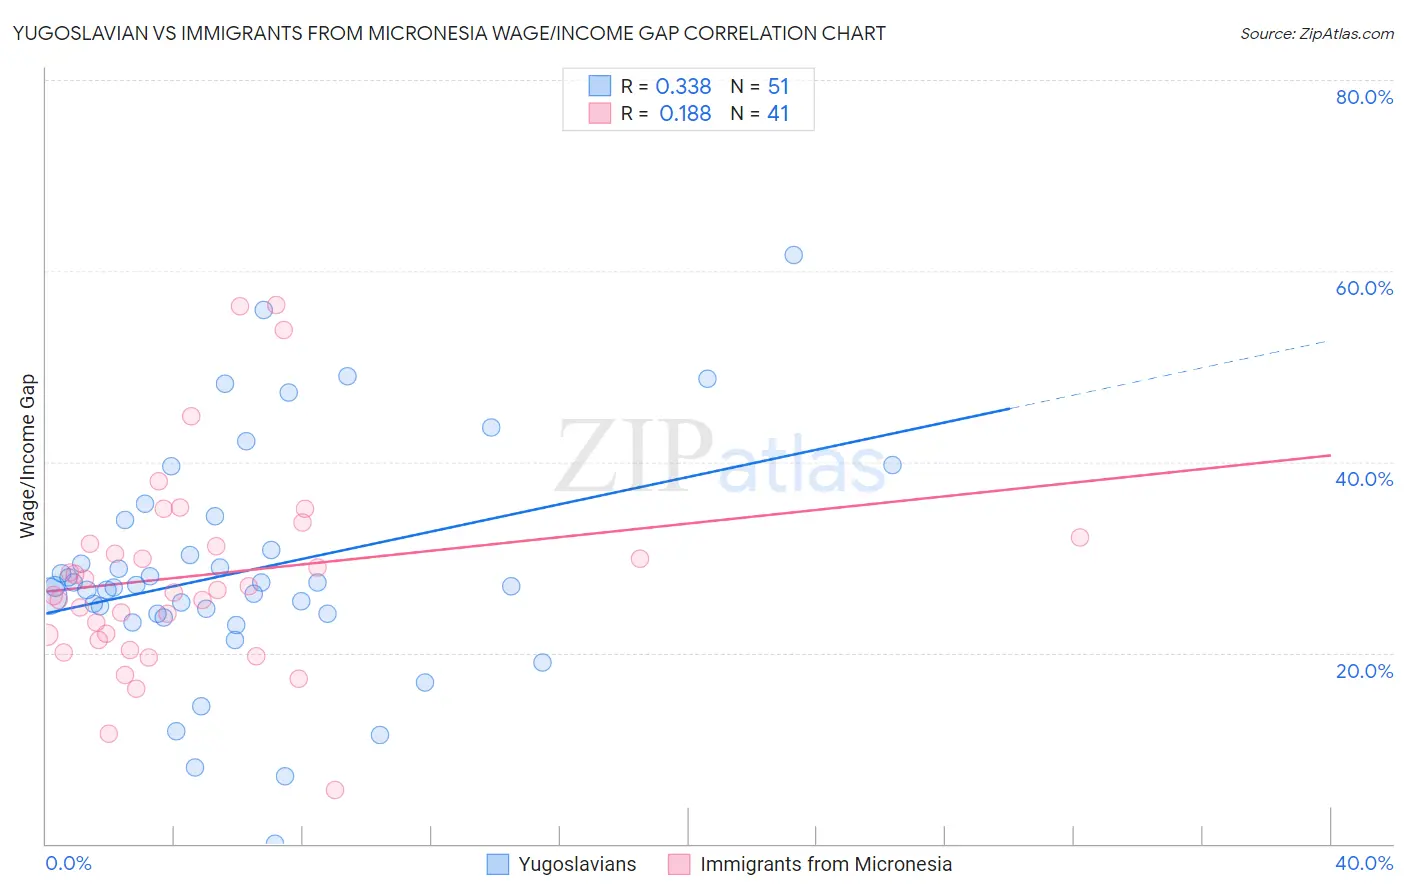
Yugoslavian vs Immigrants from Micronesia Wage/Income Gap Correlation Chart
The statistical analysis conducted on geographies consisting of 285,593,717 people shows a mild positive correlation between the proportion of Yugoslavians and wage/income gap percentage in the United States with a correlation coefficient (R) of 0.338 and weighted average of 26.7%. Similarly, the statistical analysis conducted on geographies consisting of 61,599,093 people shows a poor positive correlation between the proportion of Immigrants from Micronesia and wage/income gap percentage in the United States with a correlation coefficient (R) of 0.188 and weighted average of 24.4%, a difference of 9.2%.
Wage/Income Gap Correlation Summary
| Measurement | Yugoslavian | Immigrants from Micronesia |
| Minimum | 0.038% | 5.7% |
| Maximum | 61.7% | 56.5% |
| Range | 61.6% | 50.8% |
| Mean | 28.6% | 28.1% |
| Median | 27.0% | 26.6% |
| Interquartile 25% (IQ1) | 24.1% | 21.6% |
| Interquartile 75% (IQ3) | 33.9% | 31.8% |
| Interquartile Range (IQR) | 9.8% | 10.1% |
| Standard Deviation (Sample) | 12.0% | 10.6% |
| Standard Deviation (Population) | 11.8% | 10.5% |
Similar Demographics by Wage/Income Gap
Demographics Similar to Yugoslavians by Wage/Income Gap
In terms of wage/income gap, the demographic groups most similar to Yugoslavians are Immigrants from Portugal (26.7%, a difference of 0.040%), Immigrants from China (26.7%, a difference of 0.090%), Immigrants from Iraq (26.7%, a difference of 0.10%), Brazilian (26.7%, a difference of 0.10%), and Immigrants from Saudi Arabia (26.7%, a difference of 0.12%).
| Demographics | Rating | Rank | Wage/Income Gap |
| Egyptians | 12.7 /100 | #208 | Poor 26.6% |
| Immigrants | Kuwait | 12.6 /100 | #209 | Poor 26.6% |
| Arabs | 12.3 /100 | #210 | Poor 26.6% |
| Mongolians | 11.4 /100 | #211 | Poor 26.6% |
| Iraqis | 11.2 /100 | #212 | Poor 26.6% |
| Immigrants | Iraq | 10.3 /100 | #213 | Poor 26.7% |
| Immigrants | China | 10.3 /100 | #214 | Poor 26.7% |
| Yugoslavians | 9.7 /100 | #215 | Tragic 26.7% |
| Immigrants | Portugal | 9.5 /100 | #216 | Tragic 26.7% |
| Brazilians | 9.2 /100 | #217 | Tragic 26.7% |
| Immigrants | Saudi Arabia | 9.1 /100 | #218 | Tragic 26.7% |
| Immigrants | Poland | 8.9 /100 | #219 | Tragic 26.7% |
| Immigrants | Latvia | 8.9 /100 | #220 | Tragic 26.7% |
| Immigrants | Spain | 8.5 /100 | #221 | Tragic 26.8% |
| Bolivians | 8.3 /100 | #222 | Tragic 26.8% |
Demographics Similar to Immigrants from Micronesia by Wage/Income Gap
In terms of wage/income gap, the demographic groups most similar to Immigrants from Micronesia are Kenyan (24.5%, a difference of 0.020%), Immigrants from Afghanistan (24.4%, a difference of 0.030%), Alaska Native (24.4%, a difference of 0.090%), Cree (24.5%, a difference of 0.090%), and Immigrants from Kenya (24.4%, a difference of 0.26%).
| Demographics | Rating | Rank | Wage/Income Gap |
| Soviet Union | 97.6 /100 | #111 | Exceptional 24.2% |
| Immigrants | Colombia | 97.0 /100 | #112 | Exceptional 24.3% |
| Sioux | 96.9 /100 | #113 | Exceptional 24.3% |
| Panamanians | 96.5 /100 | #114 | Exceptional 24.4% |
| Immigrants | Kenya | 96.4 /100 | #115 | Exceptional 24.4% |
| Alaska Natives | 96.0 /100 | #116 | Exceptional 24.4% |
| Immigrants | Afghanistan | 95.9 /100 | #117 | Exceptional 24.4% |
| Immigrants | Micronesia | 95.8 /100 | #118 | Exceptional 24.4% |
| Kenyans | 95.8 /100 | #119 | Exceptional 24.5% |
| Cree | 95.6 /100 | #120 | Exceptional 24.5% |
| Immigrants | Thailand | 94.9 /100 | #121 | Exceptional 24.5% |
| Apache | 94.8 /100 | #122 | Exceptional 24.5% |
| Natives/Alaskans | 94.6 /100 | #123 | Exceptional 24.6% |
| Immigrants | South America | 93.9 /100 | #124 | Exceptional 24.6% |
| Spanish Americans | 93.8 /100 | #125 | Exceptional 24.6% |