Immigrants from the Azores vs Immigrants from Micronesia Wage/Income Gap
COMPARE
Immigrants from the Azores
Immigrants from Micronesia
Wage/Income Gap
Wage/Income Gap Comparison
Immigrants from the Azores
Immigrants from Micronesia
27.2%
WAGE/INCOME GAP
3.5/ 100
METRIC RATING
245th/ 347
METRIC RANK
24.4%
WAGE/INCOME GAP
95.8/ 100
METRIC RATING
118th/ 347
METRIC RANK
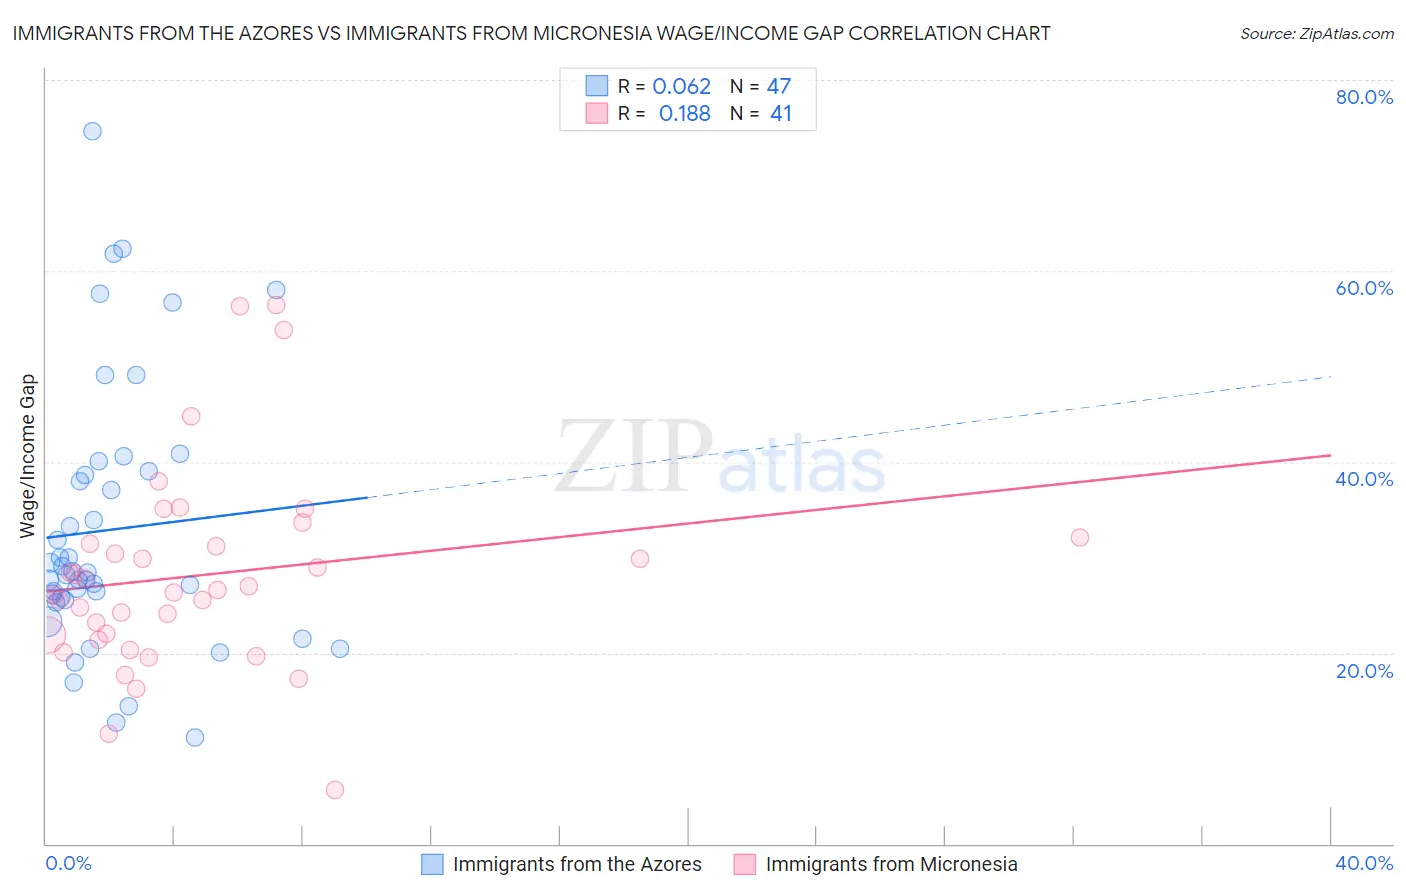
Immigrants from the Azores vs Immigrants from Micronesia Wage/Income Gap Correlation Chart
The statistical analysis conducted on geographies consisting of 46,247,590 people shows a slight positive correlation between the proportion of Immigrants from the Azores and wage/income gap percentage in the United States with a correlation coefficient (R) of 0.062 and weighted average of 27.2%. Similarly, the statistical analysis conducted on geographies consisting of 61,599,093 people shows a poor positive correlation between the proportion of Immigrants from Micronesia and wage/income gap percentage in the United States with a correlation coefficient (R) of 0.188 and weighted average of 24.4%, a difference of 11.1%.
Wage/Income Gap Correlation Summary
| Measurement | Immigrants from the Azores | Immigrants from Micronesia |
| Minimum | 11.1% | 5.7% |
| Maximum | 74.6% | 56.5% |
| Range | 63.5% | 50.8% |
| Mean | 32.9% | 28.1% |
| Median | 28.4% | 26.6% |
| Interquartile 25% (IQ1) | 25.6% | 21.6% |
| Interquartile 75% (IQ3) | 39.0% | 31.8% |
| Interquartile Range (IQR) | 13.4% | 10.1% |
| Standard Deviation (Sample) | 14.0% | 10.6% |
| Standard Deviation (Population) | 13.8% | 10.5% |
Similar Demographics by Wage/Income Gap
Demographics Similar to Immigrants from the Azores by Wage/Income Gap
In terms of wage/income gap, the demographic groups most similar to Immigrants from the Azores are Chickasaw (27.2%, a difference of 0.020%), Nonimmigrants (27.2%, a difference of 0.080%), Immigrants from Sri Lanka (27.1%, a difference of 0.090%), Spanish (27.1%, a difference of 0.090%), and Creek (27.1%, a difference of 0.14%).
| Demographics | Rating | Rank | Wage/Income Gap |
| Osage | 4.4 /100 | #238 | Tragic 27.1% |
| Estonians | 4.3 /100 | #239 | Tragic 27.1% |
| Immigrants | Europe | 3.8 /100 | #240 | Tragic 27.1% |
| Creek | 3.8 /100 | #241 | Tragic 27.1% |
| Immigrants | Sri Lanka | 3.7 /100 | #242 | Tragic 27.1% |
| Spanish | 3.6 /100 | #243 | Tragic 27.1% |
| Chickasaw | 3.5 /100 | #244 | Tragic 27.2% |
| Immigrants | Azores | 3.5 /100 | #245 | Tragic 27.2% |
| Immigrants | Nonimmigrants | 3.3 /100 | #246 | Tragic 27.2% |
| Celtics | 2.8 /100 | #247 | Tragic 27.3% |
| Cypriots | 2.8 /100 | #248 | Tragic 27.3% |
| Carpatho Rusyns | 2.7 /100 | #249 | Tragic 27.3% |
| Immigrants | Czechoslovakia | 2.7 /100 | #250 | Tragic 27.3% |
| Immigrants | Norway | 2.5 /100 | #251 | Tragic 27.3% |
| Ukrainians | 2.4 /100 | #252 | Tragic 27.3% |
Demographics Similar to Immigrants from Micronesia by Wage/Income Gap
In terms of wage/income gap, the demographic groups most similar to Immigrants from Micronesia are Kenyan (24.5%, a difference of 0.020%), Immigrants from Afghanistan (24.4%, a difference of 0.030%), Alaska Native (24.4%, a difference of 0.090%), Cree (24.5%, a difference of 0.090%), and Immigrants from Kenya (24.4%, a difference of 0.26%).
| Demographics | Rating | Rank | Wage/Income Gap |
| Soviet Union | 97.6 /100 | #111 | Exceptional 24.2% |
| Immigrants | Colombia | 97.0 /100 | #112 | Exceptional 24.3% |
| Sioux | 96.9 /100 | #113 | Exceptional 24.3% |
| Panamanians | 96.5 /100 | #114 | Exceptional 24.4% |
| Immigrants | Kenya | 96.4 /100 | #115 | Exceptional 24.4% |
| Alaska Natives | 96.0 /100 | #116 | Exceptional 24.4% |
| Immigrants | Afghanistan | 95.9 /100 | #117 | Exceptional 24.4% |
| Immigrants | Micronesia | 95.8 /100 | #118 | Exceptional 24.4% |
| Kenyans | 95.8 /100 | #119 | Exceptional 24.5% |
| Cree | 95.6 /100 | #120 | Exceptional 24.5% |
| Immigrants | Thailand | 94.9 /100 | #121 | Exceptional 24.5% |
| Apache | 94.8 /100 | #122 | Exceptional 24.5% |
| Natives/Alaskans | 94.6 /100 | #123 | Exceptional 24.6% |
| Immigrants | South America | 93.9 /100 | #124 | Exceptional 24.6% |
| Spanish Americans | 93.8 /100 | #125 | Exceptional 24.6% |