Immigrants from Hong Kong vs Czechoslovakian Currently Married
COMPARE
Immigrants from Hong Kong
Czechoslovakian
Currently Married
Currently Married Comparison
Immigrants from Hong Kong
Czechoslovakians
48.9%
CURRENTLY MARRIED
99.5/ 100
METRIC RATING
32nd/ 347
METRIC RANK
48.8%
CURRENTLY MARRIED
99.4/ 100
METRIC RATING
38th/ 347
METRIC RANK
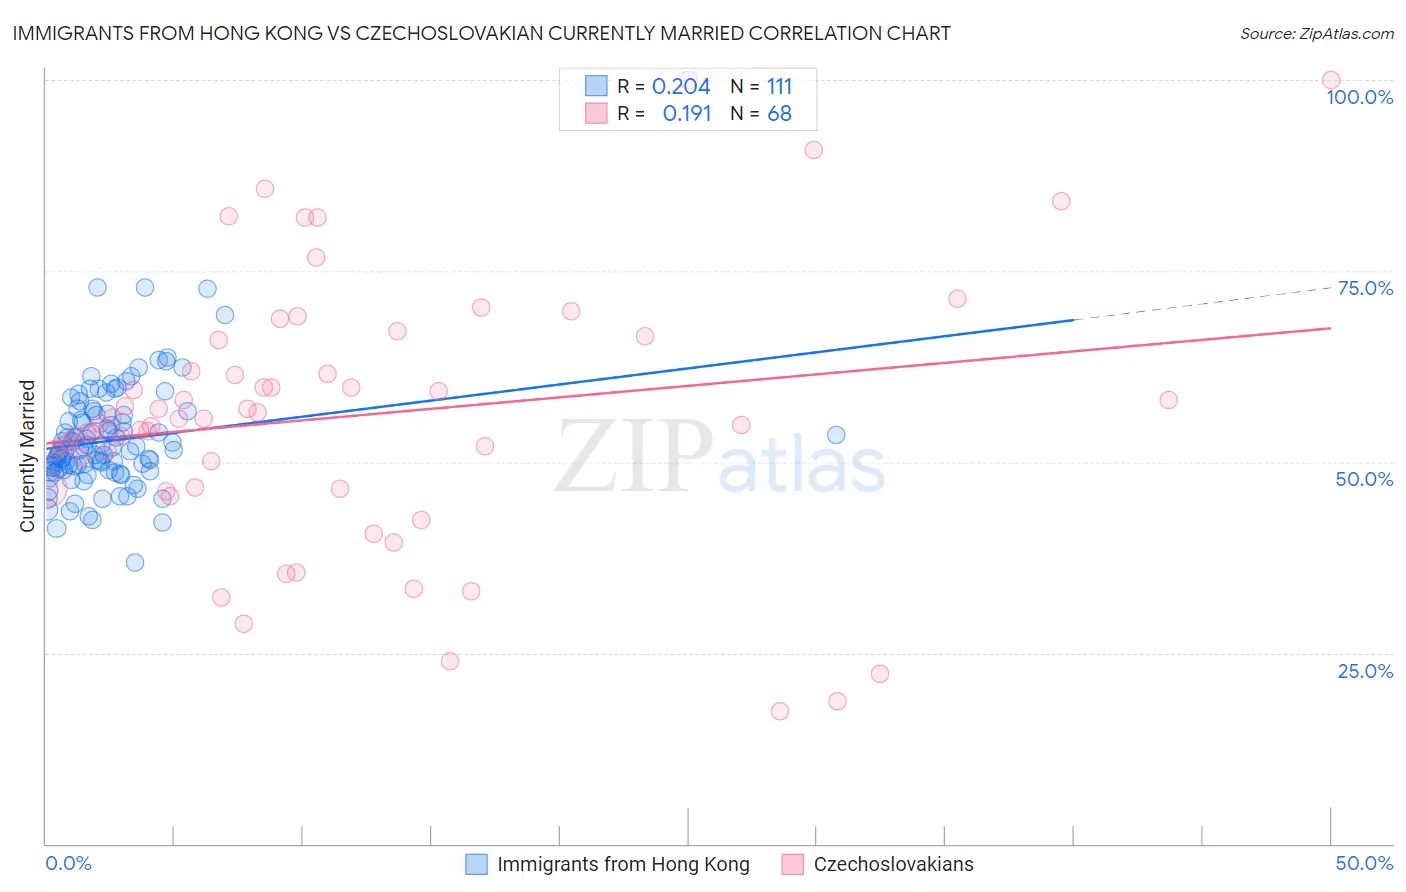
Immigrants from Hong Kong vs Czechoslovakian Currently Married Correlation Chart
The statistical analysis conducted on geographies consisting of 253,978,076 people shows a weak positive correlation between the proportion of Immigrants from Hong Kong and percentage of population currently married in the United States with a correlation coefficient (R) of 0.204 and weighted average of 48.9%. Similarly, the statistical analysis conducted on geographies consisting of 368,635,685 people shows a poor positive correlation between the proportion of Czechoslovakians and percentage of population currently married in the United States with a correlation coefficient (R) of 0.191 and weighted average of 48.8%, a difference of 0.17%.
Currently Married Correlation Summary
| Measurement | Immigrants from Hong Kong | Czechoslovakian |
| Minimum | 36.9% | 17.3% |
| Maximum | 72.8% | 100.0% |
| Range | 35.9% | 82.7% |
| Mean | 52.7% | 56.0% |
| Median | 51.5% | 55.3% |
| Interquartile 25% (IQ1) | 49.0% | 46.6% |
| Interquartile 75% (IQ3) | 56.1% | 63.9% |
| Interquartile Range (IQR) | 7.1% | 17.3% |
| Standard Deviation (Sample) | 6.4% | 17.4% |
| Standard Deviation (Population) | 6.4% | 17.3% |
Demographics Similar to Immigrants from Hong Kong and Czechoslovakians by Currently Married
In terms of currently married, the demographic groups most similar to Immigrants from Hong Kong are Eastern European (48.9%, a difference of 0.010%), Polish (48.9%, a difference of 0.010%), Croatian (48.9%, a difference of 0.020%), Irish (48.9%, a difference of 0.040%), and Welsh (48.9%, a difference of 0.070%). Similarly, the demographic groups most similar to Czechoslovakians are British (48.8%, a difference of 0.030%), Italian (48.8%, a difference of 0.040%), Hungarian (48.8%, a difference of 0.040%), Immigrants from Northern Europe (48.8%, a difference of 0.050%), and Immigrants from Canada (48.8%, a difference of 0.050%).
| Demographics | Rating | Rank | Currently Married |
| Maltese | 99.6 /100 | #25 | Exceptional 49.0% |
| Immigrants | Korea | 99.6 /100 | #26 | Exceptional 49.0% |
| Burmese | 99.6 /100 | #27 | Exceptional 48.9% |
| Welsh | 99.5 /100 | #28 | Exceptional 48.9% |
| Croatians | 99.5 /100 | #29 | Exceptional 48.9% |
| Eastern Europeans | 99.5 /100 | #30 | Exceptional 48.9% |
| Poles | 99.5 /100 | #31 | Exceptional 48.9% |
| Immigrants | Hong Kong | 99.5 /100 | #32 | Exceptional 48.9% |
| Irish | 99.5 /100 | #33 | Exceptional 48.9% |
| Immigrants | Lithuania | 99.4 /100 | #34 | Exceptional 48.8% |
| Immigrants | Northern Europe | 99.4 /100 | #35 | Exceptional 48.8% |
| Italians | 99.4 /100 | #36 | Exceptional 48.8% |
| Hungarians | 99.4 /100 | #37 | Exceptional 48.8% |
| Czechoslovakians | 99.4 /100 | #38 | Exceptional 48.8% |
| British | 99.4 /100 | #39 | Exceptional 48.8% |
| Immigrants | Canada | 99.4 /100 | #40 | Exceptional 48.8% |
| Greeks | 99.3 /100 | #41 | Exceptional 48.8% |
| Finns | 99.3 /100 | #42 | Exceptional 48.8% |
| Scotch-Irish | 99.3 /100 | #43 | Exceptional 48.7% |
| Immigrants | North America | 99.3 /100 | #44 | Exceptional 48.7% |
| Belgians | 99.3 /100 | #45 | Exceptional 48.7% |