Immigrants from the Azores vs Czechoslovakian Wage/Income Gap
COMPARE
Immigrants from the Azores
Czechoslovakian
Wage/Income Gap
Wage/Income Gap Comparison
Immigrants from the Azores
Czechoslovakians
27.2%
WAGE/INCOME GAP
3.5/ 100
METRIC RATING
245th/ 347
METRIC RANK
28.2%
WAGE/INCOME GAP
0.3/ 100
METRIC RATING
291st/ 347
METRIC RANK
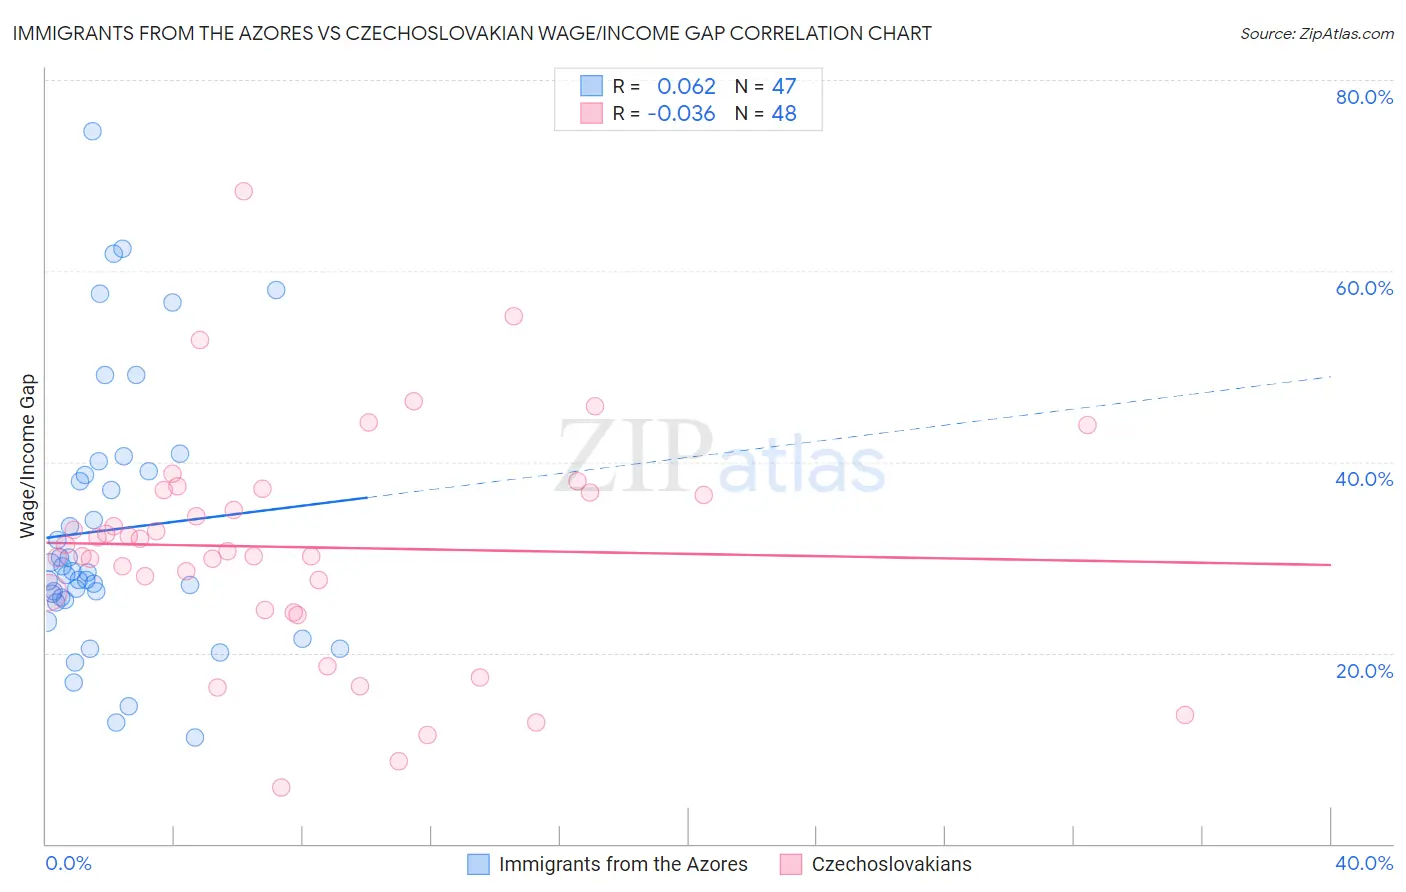
Immigrants from the Azores vs Czechoslovakian Wage/Income Gap Correlation Chart
The statistical analysis conducted on geographies consisting of 46,247,590 people shows a slight positive correlation between the proportion of Immigrants from the Azores and wage/income gap percentage in the United States with a correlation coefficient (R) of 0.062 and weighted average of 27.2%. Similarly, the statistical analysis conducted on geographies consisting of 368,390,437 people shows no correlation between the proportion of Czechoslovakians and wage/income gap percentage in the United States with a correlation coefficient (R) of -0.036 and weighted average of 28.2%, a difference of 3.8%.
Wage/Income Gap Correlation Summary
| Measurement | Immigrants from the Azores | Czechoslovakian |
| Minimum | 11.1% | 6.0% |
| Maximum | 74.6% | 68.3% |
| Range | 63.5% | 62.4% |
| Mean | 32.9% | 31.1% |
| Median | 28.4% | 31.0% |
| Interquartile 25% (IQ1) | 25.6% | 25.4% |
| Interquartile 75% (IQ3) | 39.0% | 36.9% |
| Interquartile Range (IQR) | 13.4% | 11.5% |
| Standard Deviation (Sample) | 14.0% | 11.9% |
| Standard Deviation (Population) | 13.8% | 11.8% |
Similar Demographics by Wage/Income Gap
Demographics Similar to Immigrants from the Azores by Wage/Income Gap
In terms of wage/income gap, the demographic groups most similar to Immigrants from the Azores are Chickasaw (27.2%, a difference of 0.020%), Nonimmigrants (27.2%, a difference of 0.080%), Immigrants from Sri Lanka (27.1%, a difference of 0.090%), Spanish (27.1%, a difference of 0.090%), and Creek (27.1%, a difference of 0.14%).
| Demographics | Rating | Rank | Wage/Income Gap |
| Osage | 4.4 /100 | #238 | Tragic 27.1% |
| Estonians | 4.3 /100 | #239 | Tragic 27.1% |
| Immigrants | Europe | 3.8 /100 | #240 | Tragic 27.1% |
| Creek | 3.8 /100 | #241 | Tragic 27.1% |
| Immigrants | Sri Lanka | 3.7 /100 | #242 | Tragic 27.1% |
| Spanish | 3.6 /100 | #243 | Tragic 27.1% |
| Chickasaw | 3.5 /100 | #244 | Tragic 27.2% |
| Immigrants | Azores | 3.5 /100 | #245 | Tragic 27.2% |
| Immigrants | Nonimmigrants | 3.3 /100 | #246 | Tragic 27.2% |
| Celtics | 2.8 /100 | #247 | Tragic 27.3% |
| Cypriots | 2.8 /100 | #248 | Tragic 27.3% |
| Carpatho Rusyns | 2.7 /100 | #249 | Tragic 27.3% |
| Immigrants | Czechoslovakia | 2.7 /100 | #250 | Tragic 27.3% |
| Immigrants | Norway | 2.5 /100 | #251 | Tragic 27.3% |
| Ukrainians | 2.4 /100 | #252 | Tragic 27.3% |
Demographics Similar to Czechoslovakians by Wage/Income Gap
In terms of wage/income gap, the demographic groups most similar to Czechoslovakians are Immigrants from Australia (28.2%, a difference of 0.060%), Australian (28.2%, a difference of 0.070%), Canadian (28.1%, a difference of 0.16%), Immigrants from Israel (28.2%, a difference of 0.16%), and Greek (28.2%, a difference of 0.19%).
| Demographics | Rating | Rank | Wage/Income Gap |
| Immigrants | Sweden | 0.4 /100 | #284 | Tragic 28.1% |
| Italians | 0.4 /100 | #285 | Tragic 28.1% |
| Immigrants | Austria | 0.4 /100 | #286 | Tragic 28.1% |
| Okinawans | 0.4 /100 | #287 | Tragic 28.1% |
| Choctaw | 0.4 /100 | #288 | Tragic 28.1% |
| Canadians | 0.3 /100 | #289 | Tragic 28.1% |
| Australians | 0.3 /100 | #290 | Tragic 28.2% |
| Czechoslovakians | 0.3 /100 | #291 | Tragic 28.2% |
| Immigrants | Australia | 0.3 /100 | #292 | Tragic 28.2% |
| Immigrants | Israel | 0.3 /100 | #293 | Tragic 28.2% |
| Greeks | 0.3 /100 | #294 | Tragic 28.2% |
| Slovenes | 0.3 /100 | #295 | Tragic 28.3% |
| Northern Europeans | 0.3 /100 | #296 | Tragic 28.3% |
| Immigrants | North America | 0.2 /100 | #297 | Tragic 28.4% |
| Austrians | 0.2 /100 | #298 | Tragic 28.4% |