Immigrants from Eritrea vs Guatemalan 6th Grade
COMPARE
Immigrants from Eritrea
Guatemalan
6th Grade
6th Grade Comparison
Immigrants from Eritrea
Guatemalans
96.1%
6TH GRADE
0.0/ 100
METRIC RATING
289th/ 347
METRIC RANK
94.2%
6TH GRADE
0.0/ 100
METRIC RATING
340th/ 347
METRIC RANK
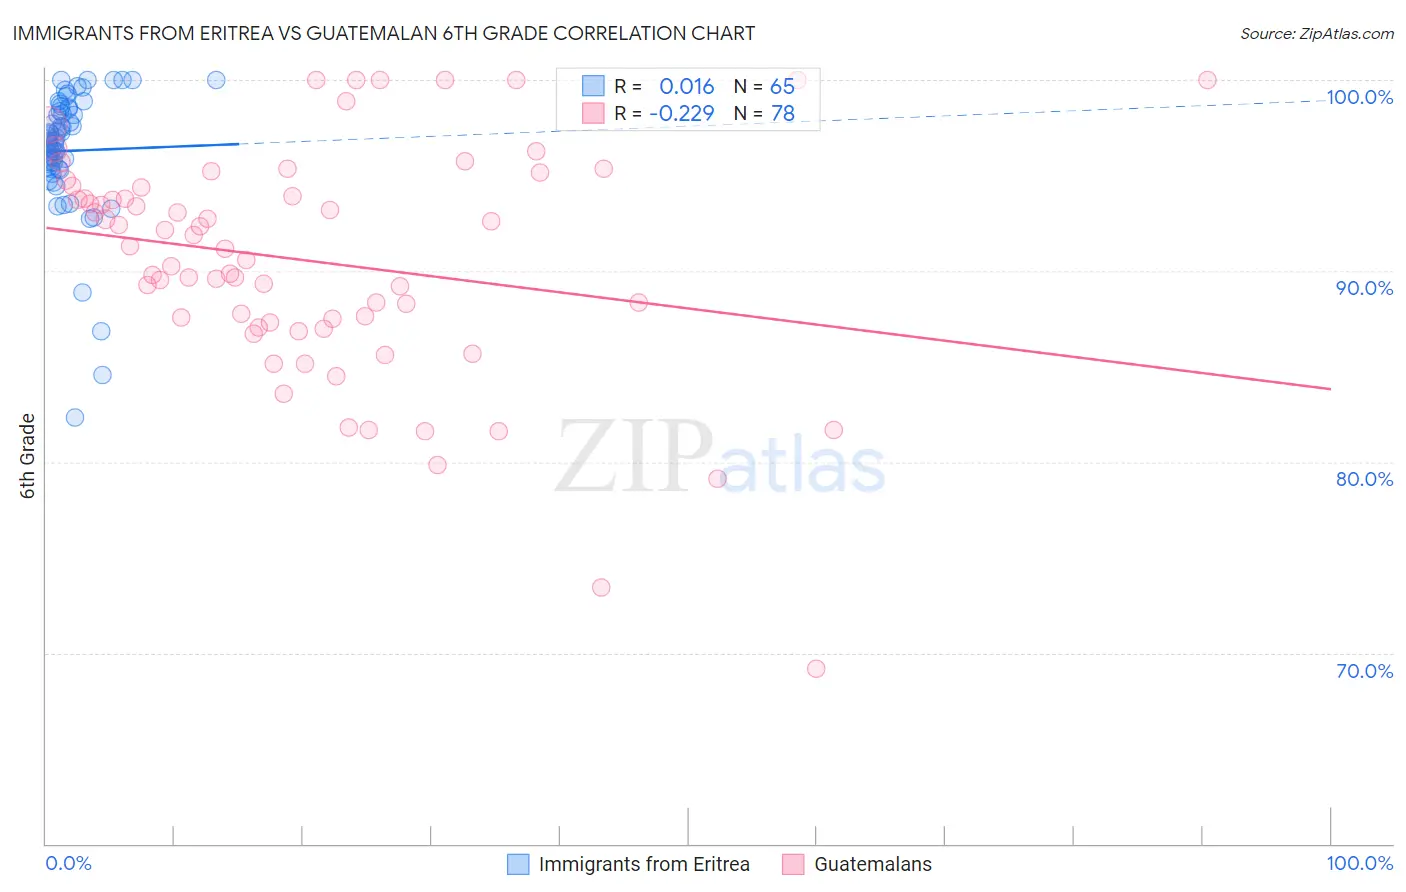
Immigrants from Eritrea vs Guatemalan 6th Grade Correlation Chart
The statistical analysis conducted on geographies consisting of 104,764,182 people shows no correlation between the proportion of Immigrants from Eritrea and percentage of population with at least 6th grade education in the United States with a correlation coefficient (R) of 0.016 and weighted average of 96.1%. Similarly, the statistical analysis conducted on geographies consisting of 409,566,469 people shows a weak negative correlation between the proportion of Guatemalans and percentage of population with at least 6th grade education in the United States with a correlation coefficient (R) of -0.229 and weighted average of 94.2%, a difference of 2.1%.
6th Grade Correlation Summary
| Measurement | Immigrants from Eritrea | Guatemalan |
| Minimum | 82.4% | 69.2% |
| Maximum | 100.0% | 100.0% |
| Range | 17.6% | 30.8% |
| Mean | 96.3% | 90.5% |
| Median | 96.8% | 91.2% |
| Interquartile 25% (IQ1) | 95.3% | 87.3% |
| Interquartile 75% (IQ3) | 98.5% | 94.4% |
| Interquartile Range (IQR) | 3.2% | 7.1% |
| Standard Deviation (Sample) | 3.4% | 6.1% |
| Standard Deviation (Population) | 3.4% | 6.0% |
Similar Demographics by 6th Grade
Demographics Similar to Immigrants from Eritrea by 6th Grade
In terms of 6th grade, the demographic groups most similar to Immigrants from Eritrea are Malaysian (96.2%, a difference of 0.020%), Immigrants from Somalia (96.1%, a difference of 0.020%), Immigrants from St. Vincent and the Grenadines (96.1%, a difference of 0.020%), Immigrants from Trinidad and Tobago (96.2%, a difference of 0.030%), and Barbadian (96.2%, a difference of 0.040%).
| Demographics | Rating | Rank | 6th Grade |
| Houma | 0.1 /100 | #282 | Tragic 96.2% |
| Cubans | 0.1 /100 | #283 | Tragic 96.2% |
| Fijians | 0.1 /100 | #284 | Tragic 96.2% |
| Somalis | 0.1 /100 | #285 | Tragic 96.2% |
| Barbadians | 0.0 /100 | #286 | Tragic 96.2% |
| Immigrants | Trinidad and Tobago | 0.0 /100 | #287 | Tragic 96.2% |
| Malaysians | 0.0 /100 | #288 | Tragic 96.2% |
| Immigrants | Eritrea | 0.0 /100 | #289 | Tragic 96.1% |
| Immigrants | Somalia | 0.0 /100 | #290 | Tragic 96.1% |
| Immigrants | St. Vincent and the Grenadines | 0.0 /100 | #291 | Tragic 96.1% |
| Immigrants | Barbados | 0.0 /100 | #292 | Tragic 96.1% |
| Immigrants | West Indies | 0.0 /100 | #293 | Tragic 96.1% |
| British West Indians | 0.0 /100 | #294 | Tragic 96.0% |
| Immigrants | Grenada | 0.0 /100 | #295 | Tragic 95.9% |
| Immigrants | South Eastern Asia | 0.0 /100 | #296 | Tragic 95.9% |
Demographics Similar to Guatemalans by 6th Grade
In terms of 6th grade, the demographic groups most similar to Guatemalans are Yakama (94.3%, a difference of 0.11%), Immigrants from Yemen (94.1%, a difference of 0.11%), Immigrants from Central America (94.0%, a difference of 0.22%), Central American (94.5%, a difference of 0.26%), and Immigrants from Cabo Verde (94.4%, a difference of 0.26%).
| Demographics | Rating | Rank | 6th Grade |
| Immigrants | Latin America | 0.0 /100 | #333 | Tragic 94.7% |
| Immigrants | Azores | 0.0 /100 | #334 | Tragic 94.7% |
| Mexicans | 0.0 /100 | #335 | Tragic 94.6% |
| Immigrants | Dominican Republic | 0.0 /100 | #336 | Tragic 94.6% |
| Central Americans | 0.0 /100 | #337 | Tragic 94.5% |
| Immigrants | Cabo Verde | 0.0 /100 | #338 | Tragic 94.4% |
| Yakama | 0.0 /100 | #339 | Tragic 94.3% |
| Guatemalans | 0.0 /100 | #340 | Tragic 94.2% |
| Immigrants | Yemen | 0.0 /100 | #341 | Tragic 94.1% |
| Immigrants | Central America | 0.0 /100 | #342 | Tragic 94.0% |
| Immigrants | Mexico | 0.0 /100 | #343 | Tragic 93.9% |
| Immigrants | Guatemala | 0.0 /100 | #344 | Tragic 93.9% |
| Salvadorans | 0.0 /100 | #345 | Tragic 93.9% |
| Spanish American Indians | 0.0 /100 | #346 | Tragic 93.6% |
| Immigrants | El Salvador | 0.0 /100 | #347 | Tragic 93.6% |