Immigrants from Eastern Africa vs French American Indian Wage/Income Gap
COMPARE
Immigrants from Eastern Africa
French American Indian
Wage/Income Gap
Wage/Income Gap Comparison
Immigrants from Eastern Africa
French American Indians
22.8%
WAGE/INCOME GAP
99.9/ 100
METRIC RATING
73rd/ 347
METRIC RANK
25.4%
WAGE/INCOME GAP
72.5/ 100
METRIC RATING
160th/ 347
METRIC RANK
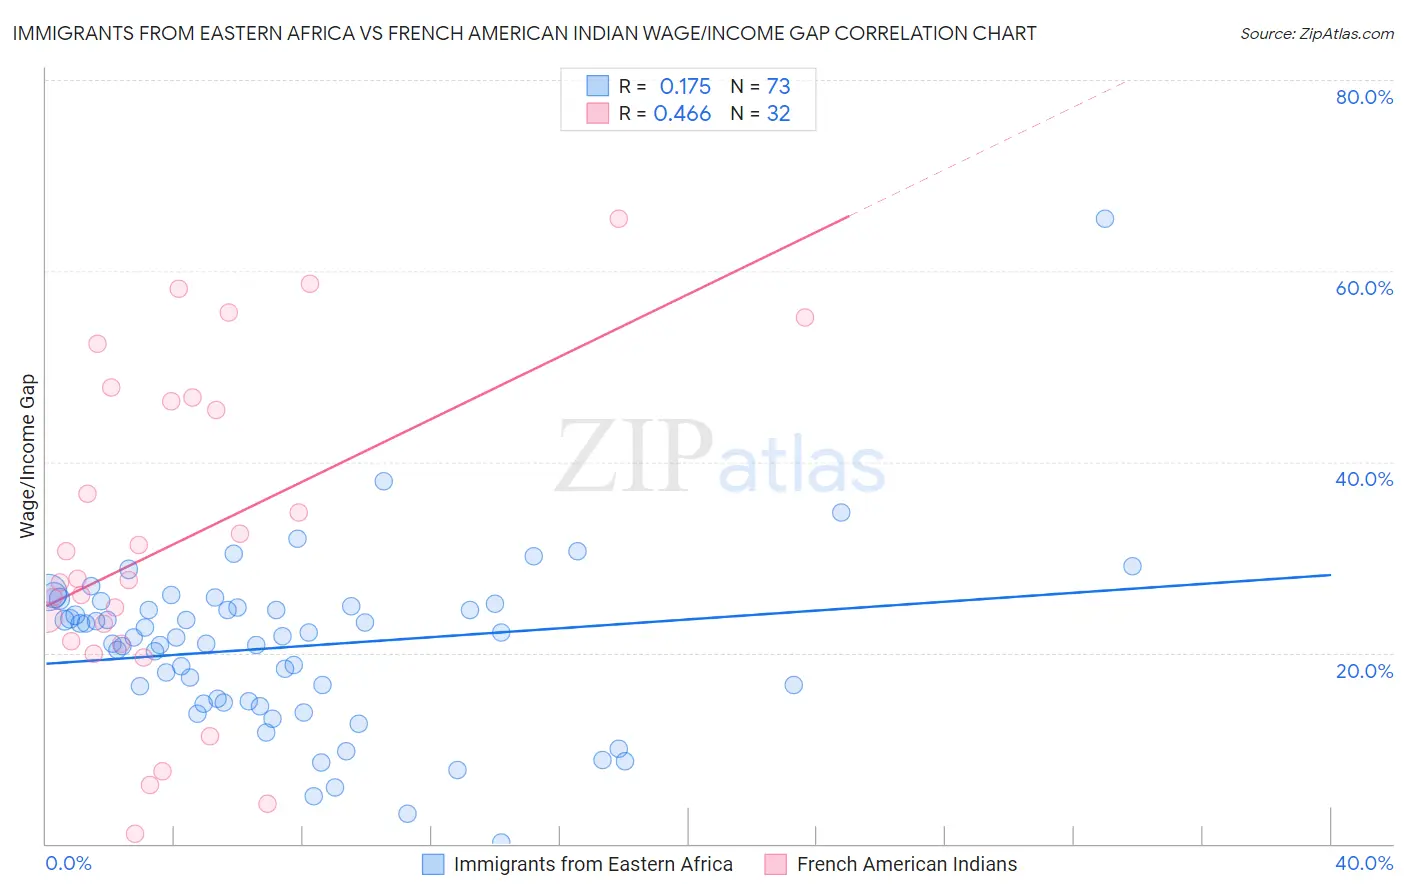
Immigrants from Eastern Africa vs French American Indian Wage/Income Gap Correlation Chart
The statistical analysis conducted on geographies consisting of 355,004,605 people shows a poor positive correlation between the proportion of Immigrants from Eastern Africa and wage/income gap percentage in the United States with a correlation coefficient (R) of 0.175 and weighted average of 22.8%. Similarly, the statistical analysis conducted on geographies consisting of 131,928,964 people shows a moderate positive correlation between the proportion of French American Indians and wage/income gap percentage in the United States with a correlation coefficient (R) of 0.466 and weighted average of 25.4%, a difference of 11.1%.
Wage/Income Gap Correlation Summary
| Measurement | Immigrants from Eastern Africa | French American Indian |
| Minimum | 0.17% | 1.1% |
| Maximum | 65.4% | 65.5% |
| Range | 65.3% | 64.4% |
| Mean | 20.7% | 31.7% |
| Median | 21.6% | 27.7% |
| Interquartile 25% (IQ1) | 14.9% | 21.1% |
| Interquartile 75% (IQ3) | 24.8% | 46.5% |
| Interquartile Range (IQR) | 9.9% | 25.5% |
| Standard Deviation (Sample) | 9.1% | 17.2% |
| Standard Deviation (Population) | 9.1% | 17.0% |
Similar Demographics by Wage/Income Gap
Demographics Similar to Immigrants from Eastern Africa by Wage/Income Gap
In terms of wage/income gap, the demographic groups most similar to Immigrants from Eastern Africa are Subsaharan African (22.8%, a difference of 0.030%), Immigrants from Burma/Myanmar (22.8%, a difference of 0.080%), Immigrants from El Salvador (22.8%, a difference of 0.18%), Immigrants from Uzbekistan (22.7%, a difference of 0.34%), and Fijian (22.9%, a difference of 0.36%).
| Demographics | Rating | Rank | Wage/Income Gap |
| Central American Indians | 99.9 /100 | #66 | Exceptional 22.7% |
| Menominee | 99.9 /100 | #67 | Exceptional 22.7% |
| Immigrants | Nigeria | 99.9 /100 | #68 | Exceptional 22.7% |
| Indonesians | 99.9 /100 | #69 | Exceptional 22.7% |
| Immigrants | Uzbekistan | 99.9 /100 | #70 | Exceptional 22.7% |
| Immigrants | El Salvador | 99.9 /100 | #71 | Exceptional 22.8% |
| Sub-Saharan Africans | 99.9 /100 | #72 | Exceptional 22.8% |
| Immigrants | Eastern Africa | 99.9 /100 | #73 | Exceptional 22.8% |
| Immigrants | Burma/Myanmar | 99.9 /100 | #74 | Exceptional 22.8% |
| Fijians | 99.9 /100 | #75 | Exceptional 22.9% |
| Ecuadorians | 99.9 /100 | #76 | Exceptional 22.9% |
| Africans | 99.9 /100 | #77 | Exceptional 22.9% |
| Nigerians | 99.9 /100 | #78 | Exceptional 23.0% |
| Immigrants | Nicaragua | 99.9 /100 | #79 | Exceptional 23.0% |
| Salvadorans | 99.9 /100 | #80 | Exceptional 23.0% |
Demographics Similar to French American Indians by Wage/Income Gap
In terms of wage/income gap, the demographic groups most similar to French American Indians are Puget Sound Salish (25.3%, a difference of 0.040%), Immigrants from Zimbabwe (25.3%, a difference of 0.10%), Albanian (25.4%, a difference of 0.26%), Costa Rican (25.3%, a difference of 0.28%), and Shoshone (25.4%, a difference of 0.28%).
| Demographics | Rating | Rank | Wage/Income Gap |
| Blackfeet | 78.1 /100 | #153 | Good 25.2% |
| Immigrants | Northern Africa | 78.1 /100 | #154 | Good 25.2% |
| Immigrants | Vietnam | 77.7 /100 | #155 | Good 25.2% |
| Immigrants | Mexico | 76.4 /100 | #156 | Good 25.3% |
| Costa Ricans | 75.8 /100 | #157 | Good 25.3% |
| Immigrants | Zimbabwe | 73.7 /100 | #158 | Good 25.3% |
| Puget Sound Salish | 73.0 /100 | #159 | Good 25.3% |
| French American Indians | 72.5 /100 | #160 | Good 25.4% |
| Albanians | 69.4 /100 | #161 | Good 25.4% |
| Shoshone | 69.0 /100 | #162 | Good 25.4% |
| Native Hawaiians | 69.0 /100 | #163 | Good 25.4% |
| Koreans | 68.6 /100 | #164 | Good 25.4% |
| Immigrants | Hong Kong | 64.0 /100 | #165 | Good 25.5% |
| Immigrants | Ukraine | 63.8 /100 | #166 | Good 25.5% |
| Paiute | 62.9 /100 | #167 | Good 25.5% |