Immigrants from Eastern Africa vs Immigrants from the Azores Wage/Income Gap
COMPARE
Immigrants from Eastern Africa
Immigrants from the Azores
Wage/Income Gap
Wage/Income Gap Comparison
Immigrants from Eastern Africa
Immigrants from the Azores
22.8%
WAGE/INCOME GAP
99.9/ 100
METRIC RATING
73rd/ 347
METRIC RANK
27.2%
WAGE/INCOME GAP
3.5/ 100
METRIC RATING
245th/ 347
METRIC RANK
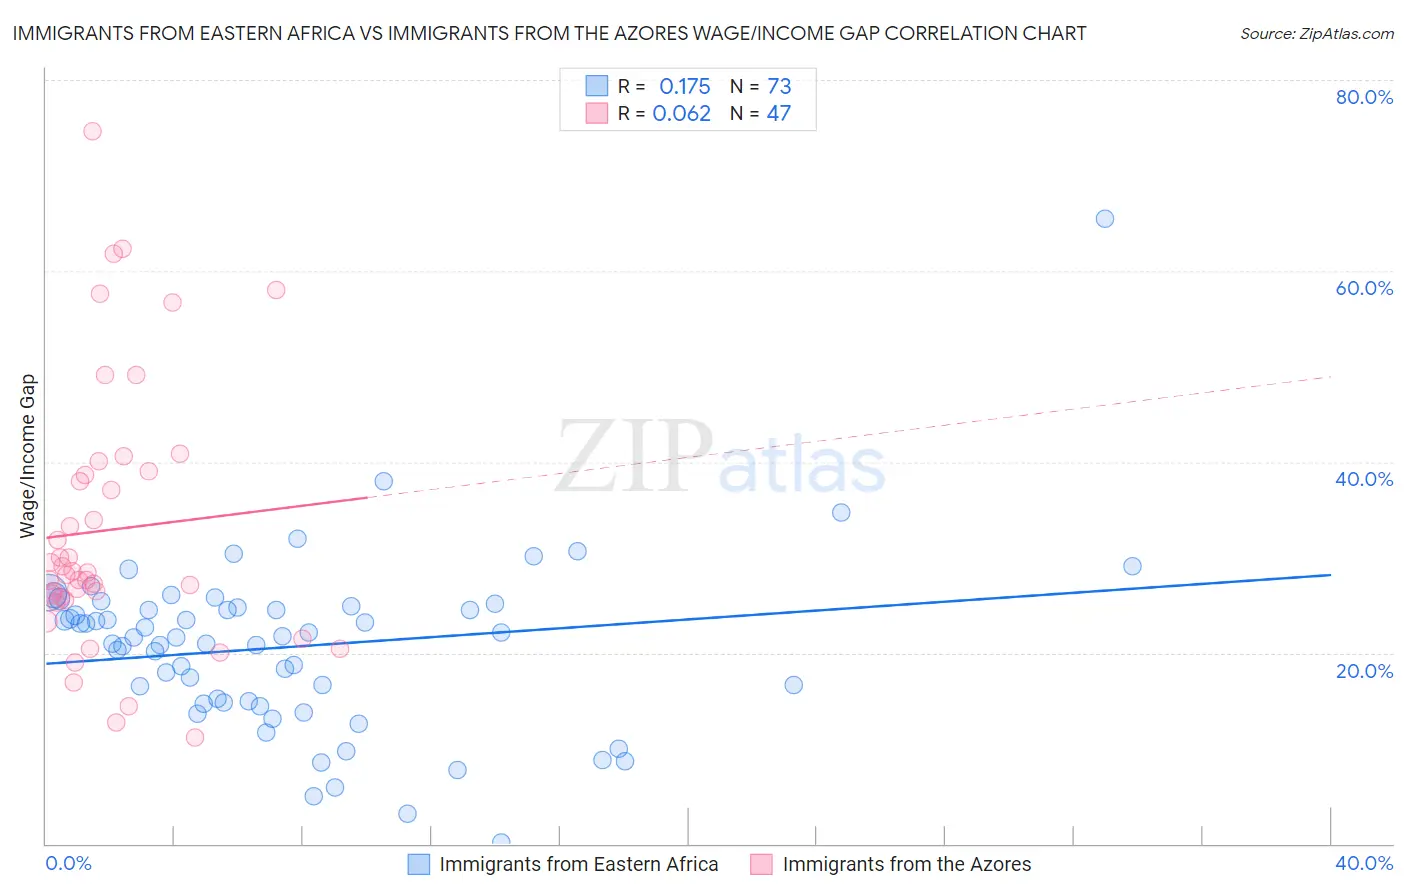
Immigrants from Eastern Africa vs Immigrants from the Azores Wage/Income Gap Correlation Chart
The statistical analysis conducted on geographies consisting of 355,004,605 people shows a poor positive correlation between the proportion of Immigrants from Eastern Africa and wage/income gap percentage in the United States with a correlation coefficient (R) of 0.175 and weighted average of 22.8%. Similarly, the statistical analysis conducted on geographies consisting of 46,247,590 people shows a slight positive correlation between the proportion of Immigrants from the Azores and wage/income gap percentage in the United States with a correlation coefficient (R) of 0.062 and weighted average of 27.2%, a difference of 19.0%.
Wage/Income Gap Correlation Summary
| Measurement | Immigrants from Eastern Africa | Immigrants from the Azores |
| Minimum | 0.17% | 11.1% |
| Maximum | 65.4% | 74.6% |
| Range | 65.3% | 63.5% |
| Mean | 20.7% | 32.9% |
| Median | 21.6% | 28.4% |
| Interquartile 25% (IQ1) | 14.9% | 25.6% |
| Interquartile 75% (IQ3) | 24.8% | 39.0% |
| Interquartile Range (IQR) | 9.9% | 13.4% |
| Standard Deviation (Sample) | 9.1% | 14.0% |
| Standard Deviation (Population) | 9.1% | 13.8% |
Similar Demographics by Wage/Income Gap
Demographics Similar to Immigrants from Eastern Africa by Wage/Income Gap
In terms of wage/income gap, the demographic groups most similar to Immigrants from Eastern Africa are Subsaharan African (22.8%, a difference of 0.030%), Immigrants from Burma/Myanmar (22.8%, a difference of 0.080%), Immigrants from El Salvador (22.8%, a difference of 0.18%), Immigrants from Uzbekistan (22.7%, a difference of 0.34%), and Fijian (22.9%, a difference of 0.36%).
| Demographics | Rating | Rank | Wage/Income Gap |
| Central American Indians | 99.9 /100 | #66 | Exceptional 22.7% |
| Menominee | 99.9 /100 | #67 | Exceptional 22.7% |
| Immigrants | Nigeria | 99.9 /100 | #68 | Exceptional 22.7% |
| Indonesians | 99.9 /100 | #69 | Exceptional 22.7% |
| Immigrants | Uzbekistan | 99.9 /100 | #70 | Exceptional 22.7% |
| Immigrants | El Salvador | 99.9 /100 | #71 | Exceptional 22.8% |
| Sub-Saharan Africans | 99.9 /100 | #72 | Exceptional 22.8% |
| Immigrants | Eastern Africa | 99.9 /100 | #73 | Exceptional 22.8% |
| Immigrants | Burma/Myanmar | 99.9 /100 | #74 | Exceptional 22.8% |
| Fijians | 99.9 /100 | #75 | Exceptional 22.9% |
| Ecuadorians | 99.9 /100 | #76 | Exceptional 22.9% |
| Africans | 99.9 /100 | #77 | Exceptional 22.9% |
| Nigerians | 99.9 /100 | #78 | Exceptional 23.0% |
| Immigrants | Nicaragua | 99.9 /100 | #79 | Exceptional 23.0% |
| Salvadorans | 99.9 /100 | #80 | Exceptional 23.0% |
Demographics Similar to Immigrants from the Azores by Wage/Income Gap
In terms of wage/income gap, the demographic groups most similar to Immigrants from the Azores are Chickasaw (27.2%, a difference of 0.020%), Nonimmigrants (27.2%, a difference of 0.080%), Immigrants from Sri Lanka (27.1%, a difference of 0.090%), Spanish (27.1%, a difference of 0.090%), and Creek (27.1%, a difference of 0.14%).
| Demographics | Rating | Rank | Wage/Income Gap |
| Osage | 4.4 /100 | #238 | Tragic 27.1% |
| Estonians | 4.3 /100 | #239 | Tragic 27.1% |
| Immigrants | Europe | 3.8 /100 | #240 | Tragic 27.1% |
| Creek | 3.8 /100 | #241 | Tragic 27.1% |
| Immigrants | Sri Lanka | 3.7 /100 | #242 | Tragic 27.1% |
| Spanish | 3.6 /100 | #243 | Tragic 27.1% |
| Chickasaw | 3.5 /100 | #244 | Tragic 27.2% |
| Immigrants | Azores | 3.5 /100 | #245 | Tragic 27.2% |
| Immigrants | Nonimmigrants | 3.3 /100 | #246 | Tragic 27.2% |
| Celtics | 2.8 /100 | #247 | Tragic 27.3% |
| Cypriots | 2.8 /100 | #248 | Tragic 27.3% |
| Carpatho Rusyns | 2.7 /100 | #249 | Tragic 27.3% |
| Immigrants | Czechoslovakia | 2.7 /100 | #250 | Tragic 27.3% |
| Immigrants | Norway | 2.5 /100 | #251 | Tragic 27.3% |
| Ukrainians | 2.4 /100 | #252 | Tragic 27.3% |