Immigrants from Cameroon vs Cape Verdean Wage/Income Gap
COMPARE
Immigrants from Cameroon
Cape Verdean
Wage/Income Gap
Wage/Income Gap Comparison
Immigrants from Cameroon
Cape Verdeans
22.2%
WAGE/INCOME GAP
100.0/ 100
METRIC RATING
52nd/ 347
METRIC RANK
23.6%
WAGE/INCOME GAP
99.4/ 100
METRIC RATING
95th/ 347
METRIC RANK
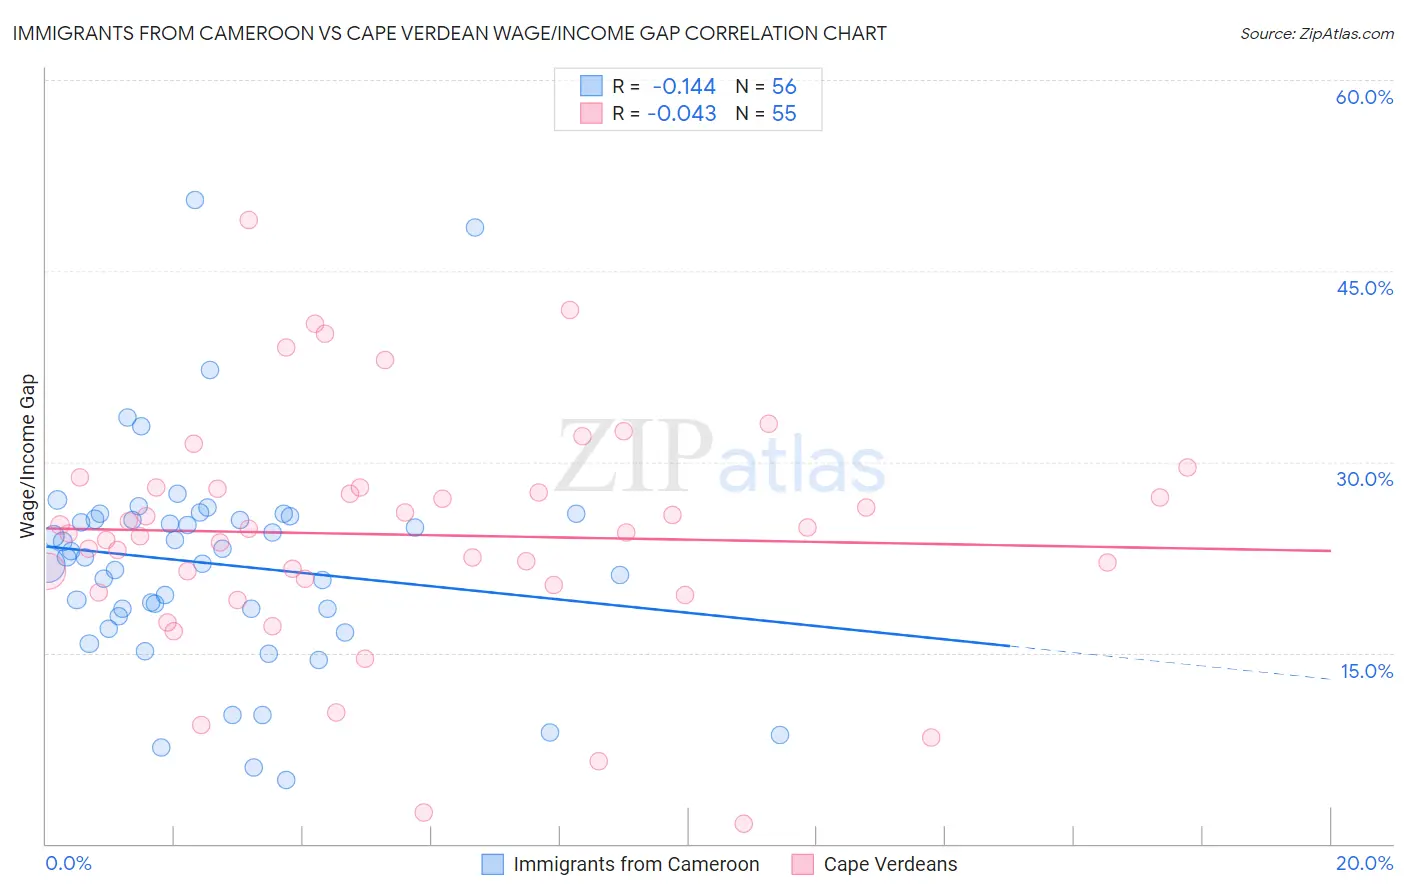
Immigrants from Cameroon vs Cape Verdean Wage/Income Gap Correlation Chart
The statistical analysis conducted on geographies consisting of 130,750,722 people shows a poor negative correlation between the proportion of Immigrants from Cameroon and wage/income gap percentage in the United States with a correlation coefficient (R) of -0.144 and weighted average of 22.2%. Similarly, the statistical analysis conducted on geographies consisting of 107,547,548 people shows no correlation between the proportion of Cape Verdeans and wage/income gap percentage in the United States with a correlation coefficient (R) of -0.043 and weighted average of 23.6%, a difference of 6.4%.
Wage/Income Gap Correlation Summary
| Measurement | Immigrants from Cameroon | Cape Verdean |
| Minimum | 5.0% | 1.5% |
| Maximum | 50.6% | 49.0% |
| Range | 45.7% | 47.5% |
| Mean | 22.0% | 24.3% |
| Median | 22.5% | 24.5% |
| Interquartile 25% (IQ1) | 18.2% | 20.3% |
| Interquartile 75% (IQ3) | 25.6% | 28.0% |
| Interquartile Range (IQR) | 7.5% | 7.6% |
| Standard Deviation (Sample) | 8.5% | 9.2% |
| Standard Deviation (Population) | 8.5% | 9.2% |
Similar Demographics by Wage/Income Gap
Demographics Similar to Immigrants from Cameroon by Wage/Income Gap
In terms of wage/income gap, the demographic groups most similar to Immigrants from Cameroon are Bangladeshi (22.2%, a difference of 0.010%), Tohono O'odham (22.1%, a difference of 0.080%), Nepalese (22.2%, a difference of 0.24%), Immigrants from Western Africa (22.0%, a difference of 0.52%), and Immigrants from Zaire (22.3%, a difference of 0.64%).
| Demographics | Rating | Rank | Wage/Income Gap |
| U.S. Virgin Islanders | 100.0 /100 | #45 | Exceptional 21.5% |
| Immigrants | Ethiopia | 100.0 /100 | #46 | Exceptional 21.6% |
| Immigrants | Congo | 100.0 /100 | #47 | Exceptional 21.7% |
| Blacks/African Americans | 100.0 /100 | #48 | Exceptional 21.7% |
| Ethiopians | 100.0 /100 | #49 | Exceptional 21.8% |
| Immigrants | Western Africa | 100.0 /100 | #50 | Exceptional 22.0% |
| Tohono O'odham | 100.0 /100 | #51 | Exceptional 22.1% |
| Immigrants | Cameroon | 100.0 /100 | #52 | Exceptional 22.2% |
| Bangladeshis | 100.0 /100 | #53 | Exceptional 22.2% |
| Nepalese | 100.0 /100 | #54 | Exceptional 22.2% |
| Immigrants | Zaire | 100.0 /100 | #55 | Exceptional 22.3% |
| Immigrants | Ghana | 100.0 /100 | #56 | Exceptional 22.3% |
| Ghanaians | 100.0 /100 | #57 | Exceptional 22.3% |
| Immigrants | Cuba | 100.0 /100 | #58 | Exceptional 22.4% |
| Navajo | 100.0 /100 | #59 | Exceptional 22.4% |
Demographics Similar to Cape Verdeans by Wage/Income Gap
In terms of wage/income gap, the demographic groups most similar to Cape Verdeans are Honduran (23.6%, a difference of 0.030%), Immigrants from Cabo Verde (23.6%, a difference of 0.12%), Kiowa (23.6%, a difference of 0.12%), Immigrants from Sudan (23.6%, a difference of 0.21%), and Immigrants from Honduras (23.5%, a difference of 0.36%).
| Demographics | Rating | Rank | Wage/Income Gap |
| Immigrants | Panama | 99.6 /100 | #88 | Exceptional 23.4% |
| Marshallese | 99.6 /100 | #89 | Exceptional 23.4% |
| Nicaraguans | 99.6 /100 | #90 | Exceptional 23.4% |
| Arapaho | 99.6 /100 | #91 | Exceptional 23.5% |
| Immigrants | Honduras | 99.5 /100 | #92 | Exceptional 23.5% |
| Immigrants | Cabo Verde | 99.5 /100 | #93 | Exceptional 23.6% |
| Hondurans | 99.5 /100 | #94 | Exceptional 23.6% |
| Cape Verdeans | 99.4 /100 | #95 | Exceptional 23.6% |
| Kiowa | 99.4 /100 | #96 | Exceptional 23.6% |
| Immigrants | Sudan | 99.4 /100 | #97 | Exceptional 23.6% |
| Immigrants | Latin America | 99.2 /100 | #98 | Exceptional 23.7% |
| Aleuts | 99.2 /100 | #99 | Exceptional 23.7% |
| Yakama | 99.2 /100 | #100 | Exceptional 23.7% |
| Japanese | 99.1 /100 | #101 | Exceptional 23.8% |
| Immigrants | Laos | 99.0 /100 | #102 | Exceptional 23.8% |